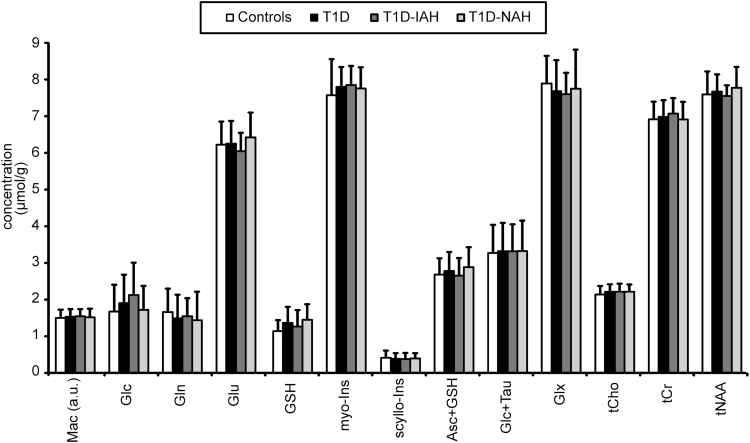
Figure 3.
Comparison of neurochemical profiles during euglycemia. Bar plot demonstrates similarity of neurochemical levels between healthy controls, (n = 18), subjects with type 1 diabetes (T1D) (n = 22) and subgroup of volunteers with T1D and impaired awareness of hypoglycemia (T1D-IAH) (n = 10), and with T1D and normal awareness of hypoglycemia (NAH) (n = 12). Bars represent mean metabolite concentrations; error bars, standard deviations. Abbreviations: Asc, ascorbate; Cr, creatine; Glc, glucose; Gln, glutamine; Glu, glutamate; Glx = Glu+Gln; GSH, glutathione; Mac, macromolecules; myo-Ins, myo-inositol; scyllo-Ins, scyllo-inositol; tCho, total choline; tCr, total creatine; tNAA, total NAA.

