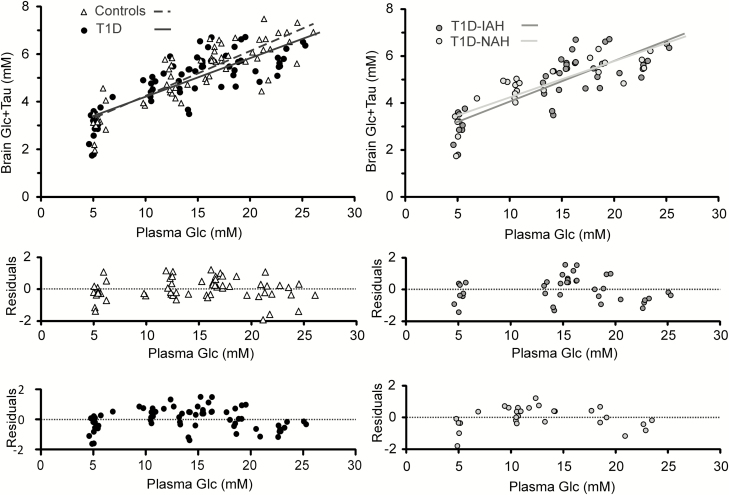
Figure 6.
Steady-state hippocampal Glc+Tau vs plasma Glc concentrations. Also shown are the best fits of the steady-state, reversible Michaelis-Menten model to the data for each of the groups (top row). There was no difference in transport parameters between the groups. Residuals of the linear fits are plotted (a separate panel per group) in the bottom part of the figure. Abbreviations: Glc, glucose; T1D, type 1 diabetes; T1D-IAH, type 1 diabetes with impaired awareness of hypoglycemia; T1D-NAH, type 1 diabetes with normal awareness of hypoglycemia.

