
Figure 4:
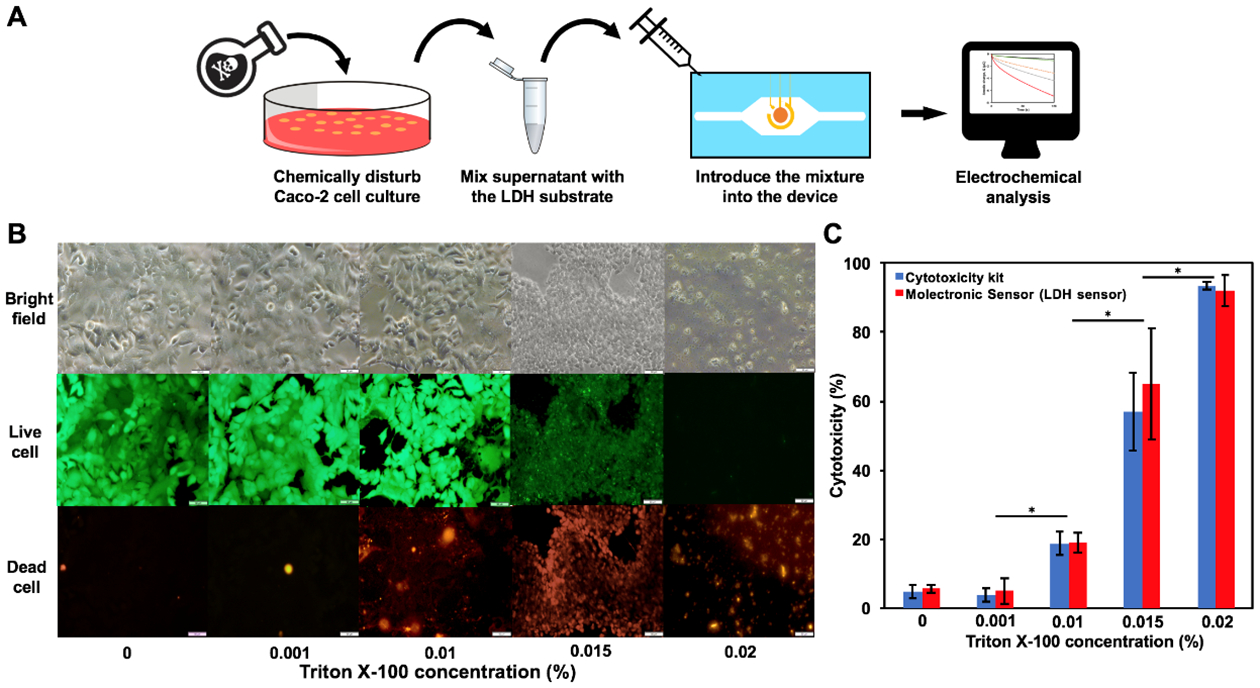
(A) Schematics demonstrating cytotoxicity assay steps using the molectronic sensor. (B) Microscopic results of Caco-2 cell cultures treated with various concentration of Triton X-100. Green and red fluorescent images depict live and dead cells after 120 min, respectively. Scale bar = 50 μm. BF: bright field. (C) Cytotoxicity measurements by the molectronic sensor and the commercialized cytotoxicity kit (*, p < 0.05). All results are normalized to data from the positive control, in which cell cultures are treated with 0.1% Triton X-100.