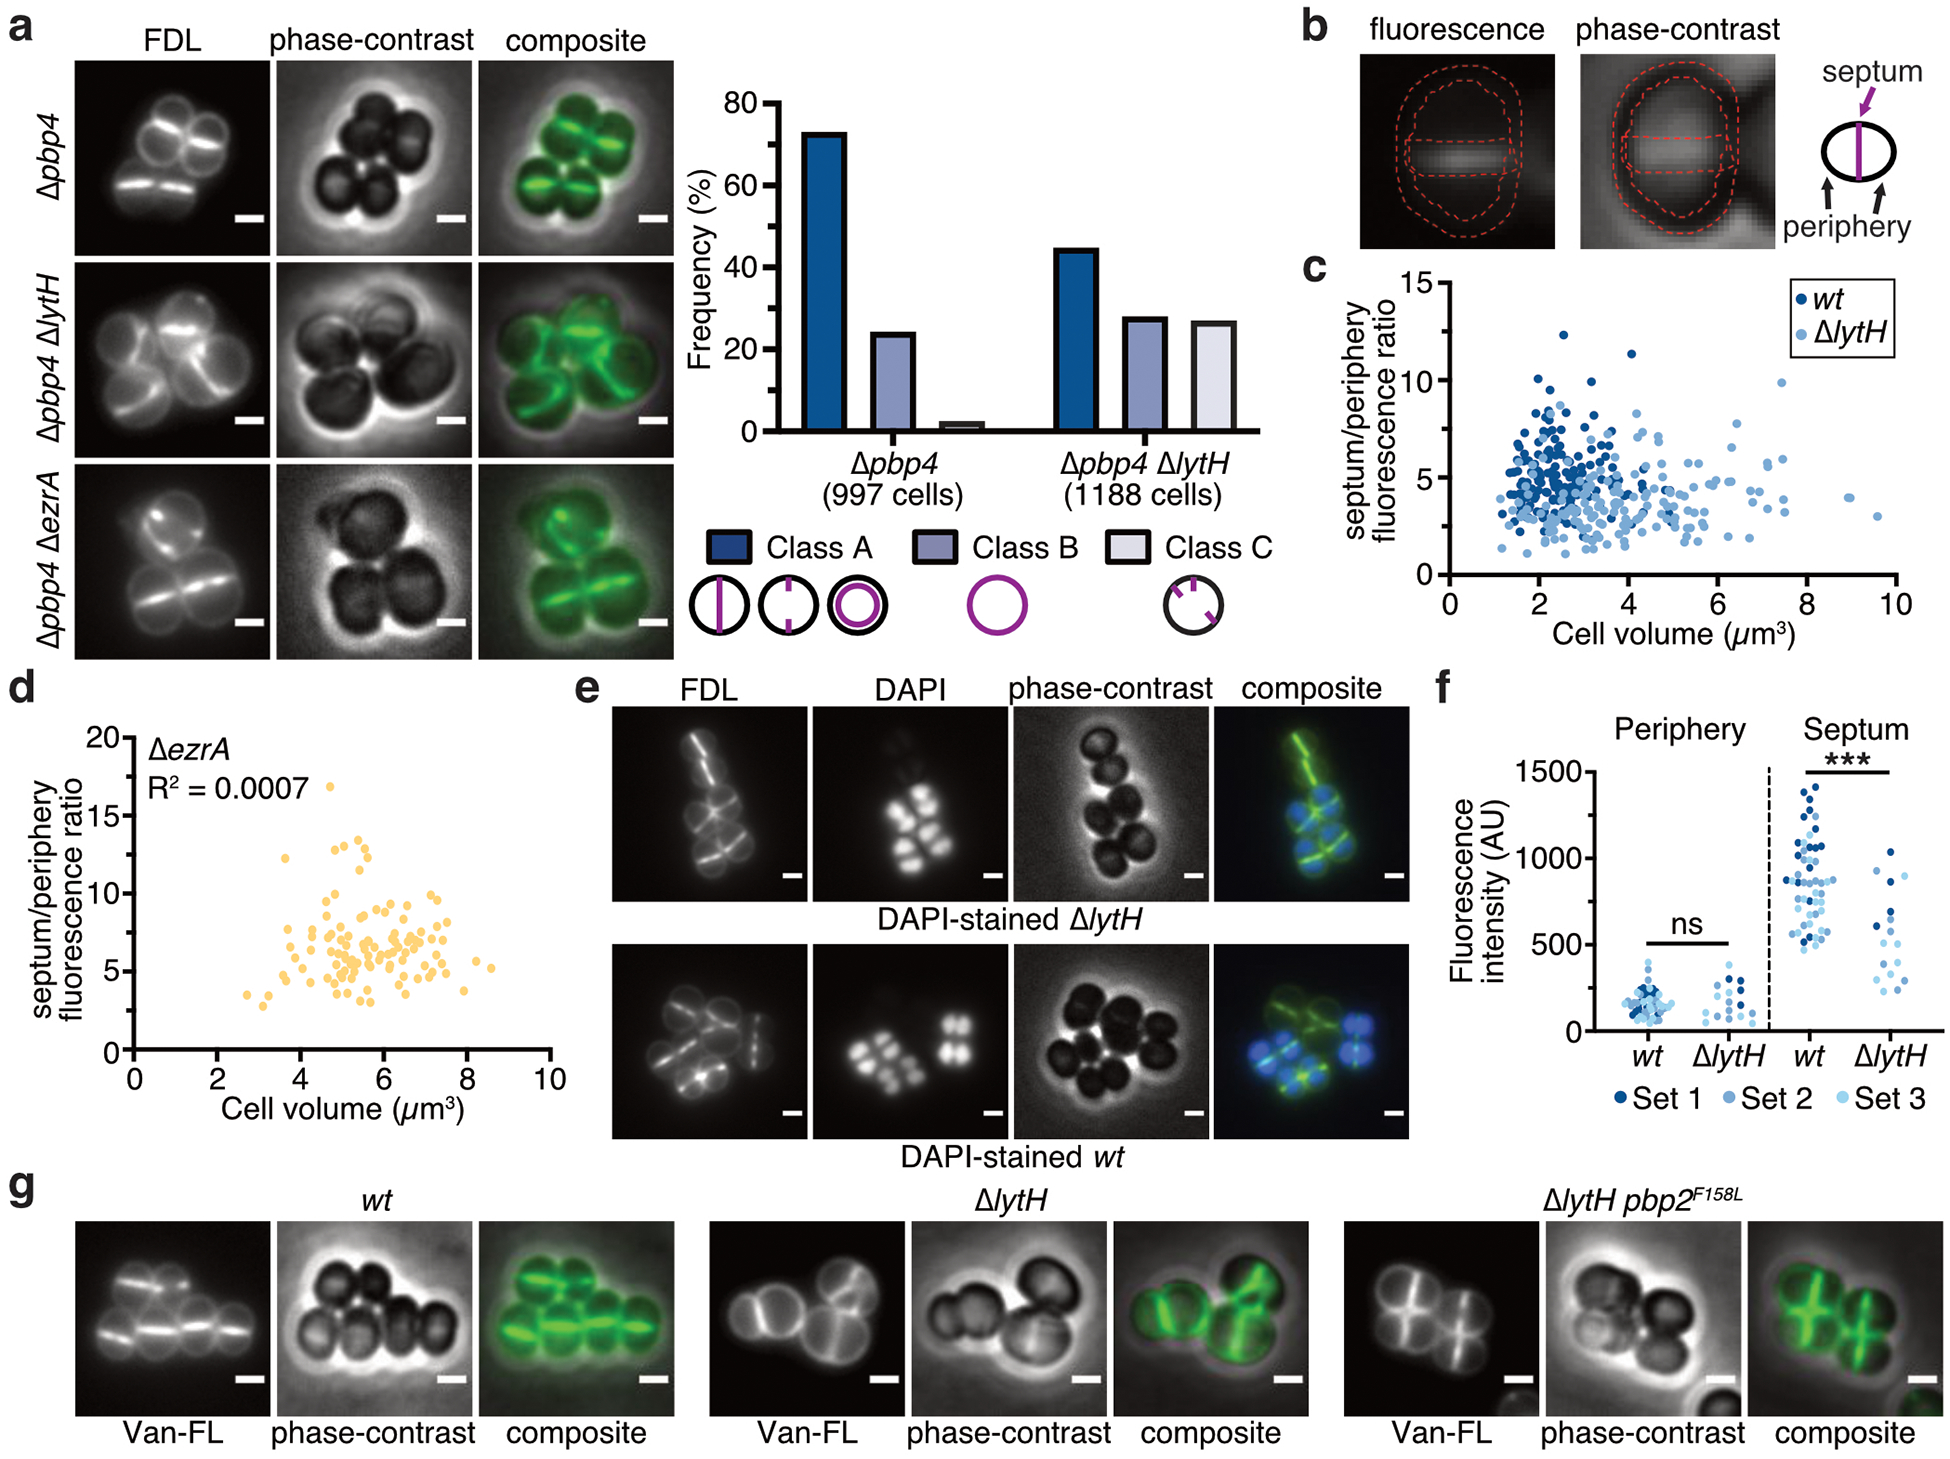
Extended Data Fig. 9. Loss of LytH reduces peptidoglycan synthesis at the septum relative to the periphery.

a, Fluorescence images of fluorescein-D-lysine (FDL)-labeled cells. All FDL labeling was performed in strains lacking PBP4 to reduce background. Cells were sorted into different classes according to the pattern of FDL signal: at the septum (Class A), around the membrane (Class B), or at misplaced septa and/or peripheral puncta (Class C). Scale bars, 1 µm. b, The ratio of fluorescence intensity at the septum vs. periphery was calculated for cells with a single complete septum. Two regions of interests, outlined in red, were defined to retrieve pixel values at the periphery and the septum. c, Deletion of lytH leads to reduced septal to peripheral FDL signal independently of cell size. Each dot represents a single cell: n = 159 (wt) and 167 (∆lytH) cells. d, FDL fluorescence ratio is not correlated with cell size (n = 105 cells). Deletion of ezrA causes division defects and larger cell size. e, Fluorescence images of an FDL-labeled, mixed population of WT and ∆lytH cells. To distinguish WT from ∆lytH cells, one strain was stained with DAPI prior to mixing the two strains and labeling with FDL. Reciprocal labeling of DAPI was performed. Scale bars, 1 µm. f, FDL signal for mixed populations containing DAPI-stained WT cells. Fluorescence intensity measurements correspond to the median intensity at the periphery or septum. Different colored dots represent cells analyzed from different fields of view (sets 1–3): n = 52 (wt) and 17 (∆lytH) cells. P-values were determined by two-sided Mann-Whitney U tests (***P < 0.001; ns, not significant). From left to right: P = 0.9389 and 7.02×10⁻⁵. g, Fluorescence images of cells labeled with fluorescent vancomycin (Van-FL) to detect newly synthesized peptidoglycan. Scale bars, 1 μm. Data are representative of two independent experiments (a–g).
