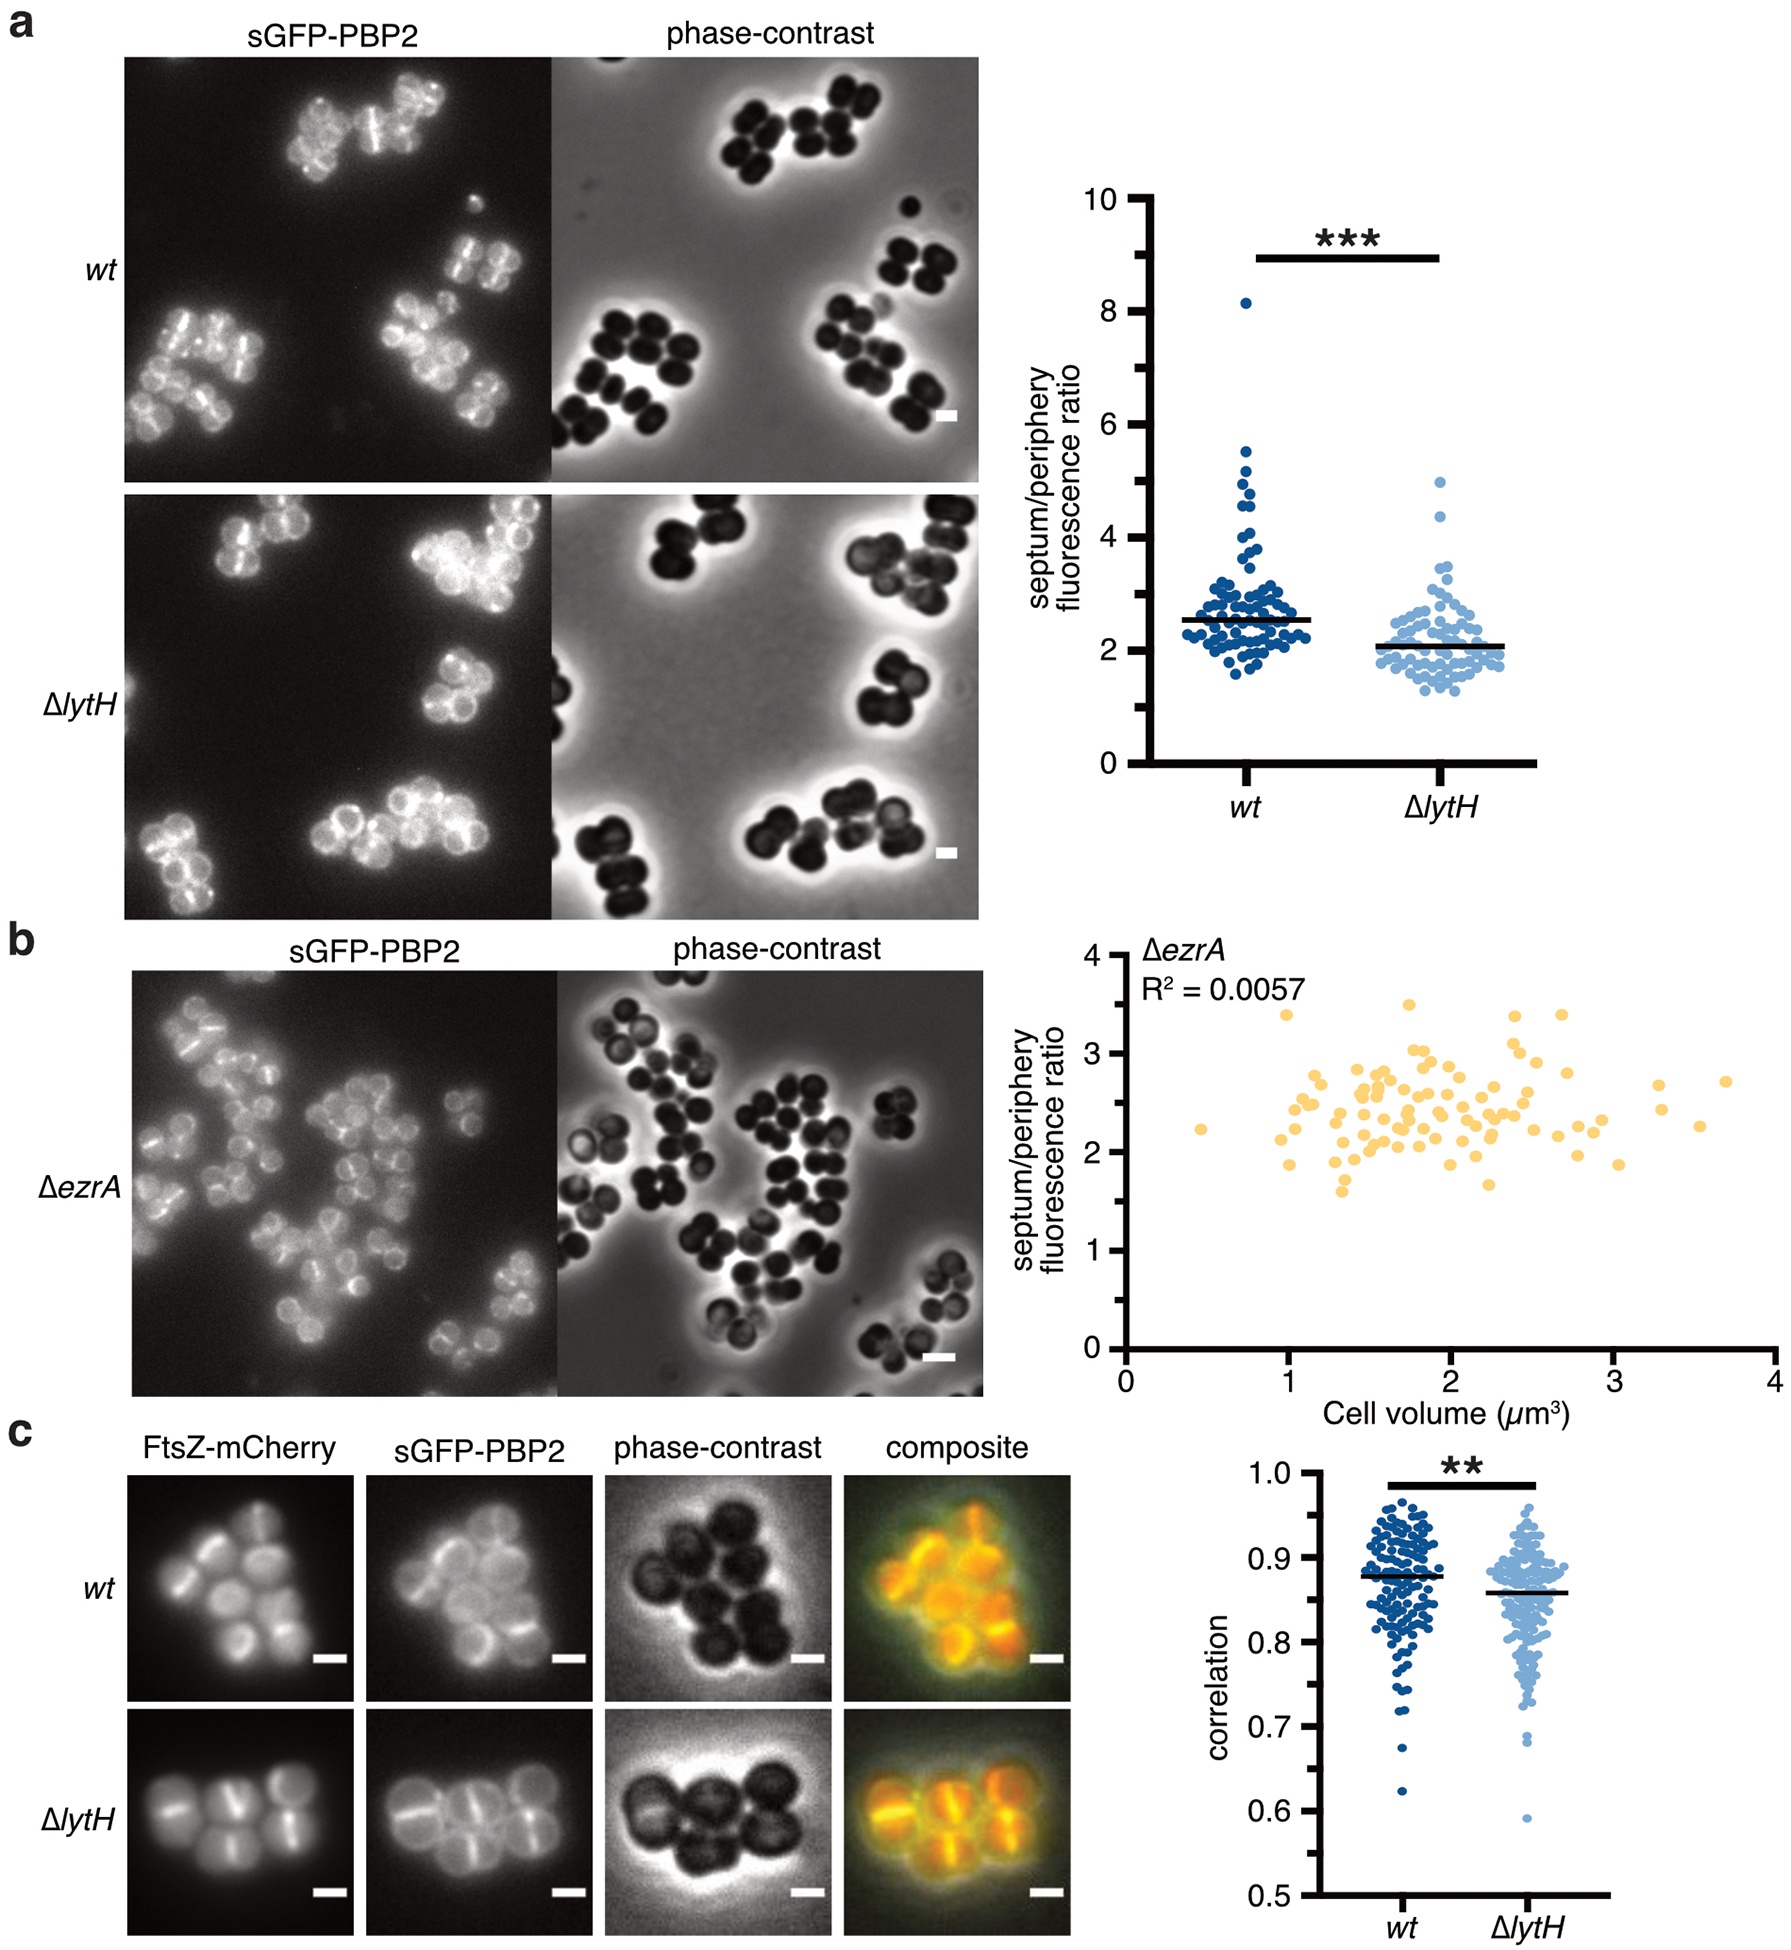
Extended Data Fig. 10. PBP2 was delocalized in the absence of LytH.

a, Fluorescence images of NCTC8325–4 strains expressing sGFP-PBP2. To compare the spatial distribution of PBP2 signal in WT vs. ∆lytH cells, fluorescence ratios were calculated using cells with a single complete septum. In all plots, each dot represents a single cell, the median of each spread is indicated by a black line, and p-values were determined by two-sided Mann-Whitney U tests. In this plot: n = 81 (wt) and 77 (∆lytH) cells; P = 8.30×10⁻⁸ (***P < 0.001). Scale bars, 1 µm. b, Fluorescence images of strain NCTC8325–4 ∆ezrA expressing sGFP-PBP2, showing that delocalization of PBP2 is independent of cell size. Fluorescence ratios of sGFP-PBP2 signal was plotted against cell volume (n = 91 cells). Scale bars, 2 µm. c, Fluorescence images of HG003 strains co-expressing sGFP-PBP2 and FtsZ-mCherry. PBP2 and FtsZ signals showed reduced colocalization in ∆lytH cells. Only cells showing FtsZ signal at the septum were considered for Pearson correlation coefficient analysis to calculate the degree of colocalization: n = 133 (wt) and 166 (∆lytH) cells; P = 0.006 (**P < 0.01). Scale bars, 1 µm. Different fields of view were captured for one biological sample (a–b). Data are representative of two (c) independent experiments.
