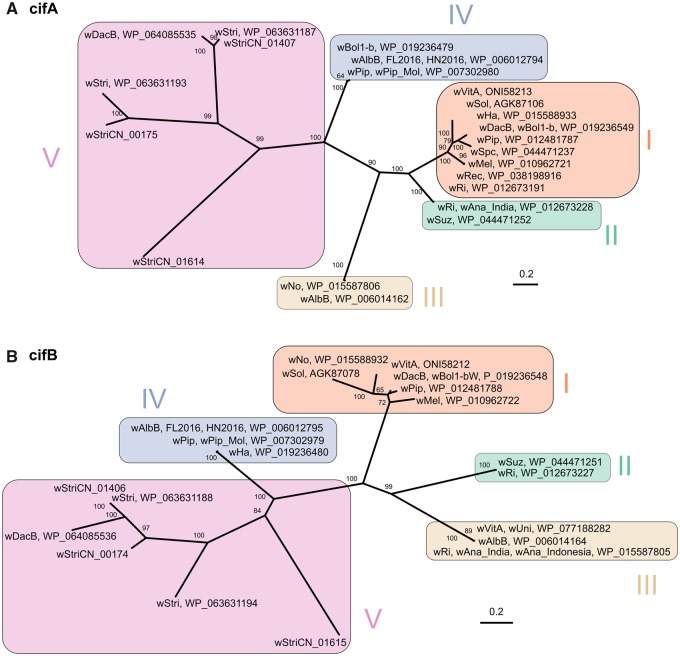
Fig. 5.
—Phylogeny of CifA (A) and CifB (B) proteins. The names of Wolbachia strains and the corresponding NCBI accession numbers of Cif proteins are shown. The tree was constructed using a JTT + F + G4 substitution model for ML analysis. Bootstrap values are indicated at the respective node (only values >50% are shown). The scale bar represents the average number of substitutions per site.

