
Table 2.
The Overall Weighted Mean Effects Comparing TM® versus Controls on Systolic and Diastolic Blood Pressure.
| Study Citation | Outcome | N | Weeks | d+ | SE | Variance | 95% CI | d+ (95% CI) | |
|---|---|---|---|---|---|---|---|---|---|
| Lower | Upper | ||||||||
| Calderon (2000) | SBP | 71 | 25 | −0.2542 | 0.2419 | 0.0585 | −0.7283 | 0.2199 | 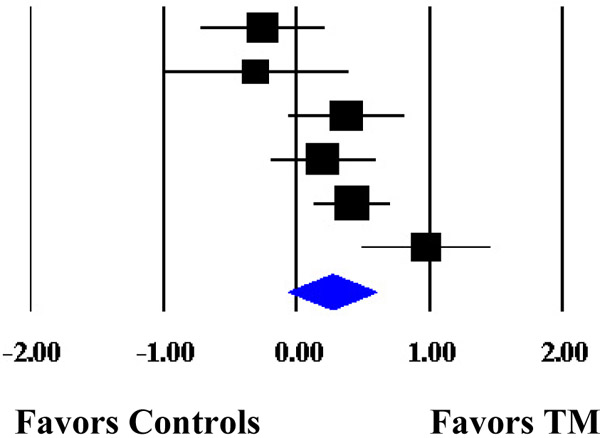 |
| Kondwani et al. (2005) | SBP | 34 | 51 | −0.3122 | 0.3591 | 0.1290 | −1.0162 | 0.3918 | |
| Paul-Labrador et al. (2006) | SBP | 84 | 15 | 0.3741 | 0.2235 | 0.0500 | −0.0642 | 0.8124 | |
| Schneider et al. (2005) | SBP | 98 | 52 | 0.1974 | 0.2058 | 0.0423 | −0.2057 | 0.6005 | |
| Schneider et al. (2012) | SBP | 183 | 281 | 0.4136 | 0.1505 | 0.0227 | 0.1183 | 0.7089 | |
| Schneider et al. (1995) | SBP | 74 | 12 | 0.9716 | 0.2501 | 0.0626 | 0.4812 | 1.4620 | |
| MM | 0.2636 | 0.1668 | 0.0278 | −0.0633 | 0.5905 | ||||
| ML | 0.2673 | 0.1547 | 0.0239 | −0.0358 | 0.5704 | ||||
| Calderon (2000) | DBP | 71 | 25 | −0.1990 | 0.2415 | 0.0583 | −0.6722 | 0.2742 | 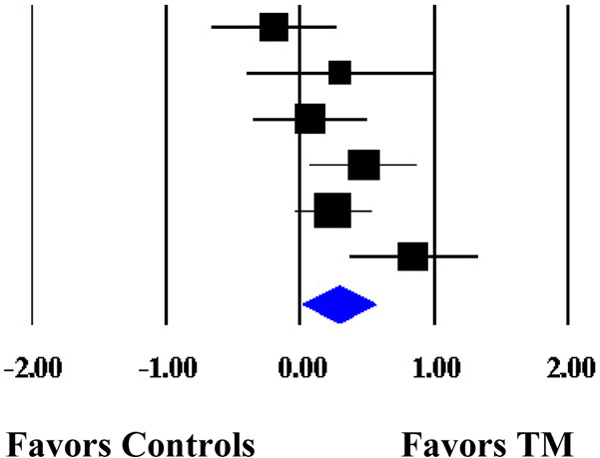 |
| Kondwani et al. (2005) | DBP | 34 | 51 | 0.2977 | 0.3589 | 0.1288 | −0.4057 | 1.0011 | |
| Paul-Labrador et al. (2006) | DBP | 84 | 15 | 0.0725 | 0.2216 | 0.0491 | −0.3618 | 0.5068 | |
| Schneider et al. (2005) | DBP | 98 | 52 | 0.4709 | 0.2081 | 0.0433 | 0.0631 | 0.8787 | |
| Schneider et al. (2012) | DBP | 183 | 281 | 0.2431 | 0.1493 | 0.0223 | −0.0496 | 0.5358 | |
| Schneider et al. (1995) | DBP | 74 | 12 | 0.8427 | 0.2467 | 0.0608 | 0.3594 | 1.3260 | |
| MM | 0.2837 | 0.1361 | 0.0185 | 0.0170 | 0.5504 | ||||
| ML | 0.2848 | 0.1571 | 0.0247 | −0.0231 | 0.5926 | ||||
Note. The overall weighted mean effect sizes are calculated using random-effects models with methods of moments (MM) and full information maximum likelihood (ML) methods to estimate the between-study variance. Weighted mean effect sizes (d+) are positive for differences that favor the transcendental meditation (TM) group relative to controls. Weeks refers to the number of weeks between the last intervention session and the assessment. d+, weighted mean effect size; SE, standard error; CI, confidence interval; SBP, systolic blood pressure; DBP, diastolic blood pressure.