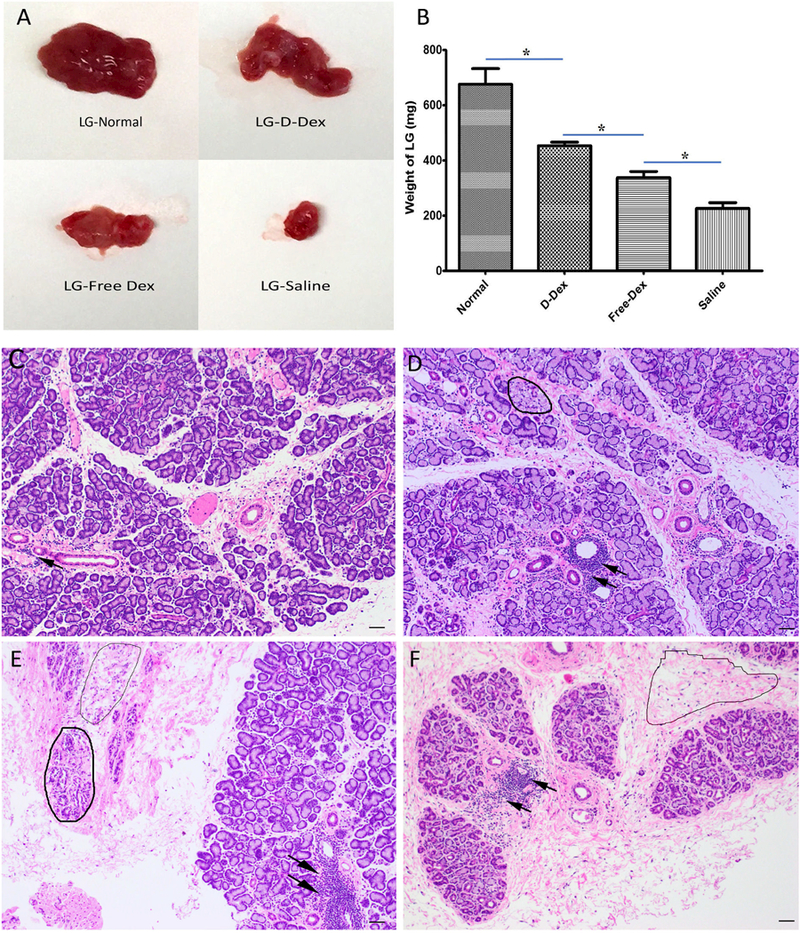
Figure 5.

Immunofluorescent micrographs of LG sections from normal, D-Dex treatment, Free-Dex treatment or saline treatment, stained for nuclei (DAPI, blue) and AQP5 (green, A) as well as quantitative analysis and comparisons among groups (B). Expression level of AQP4 and AQP5 were measured by qPCR. * p<0.05. Magnification times: 200X.
