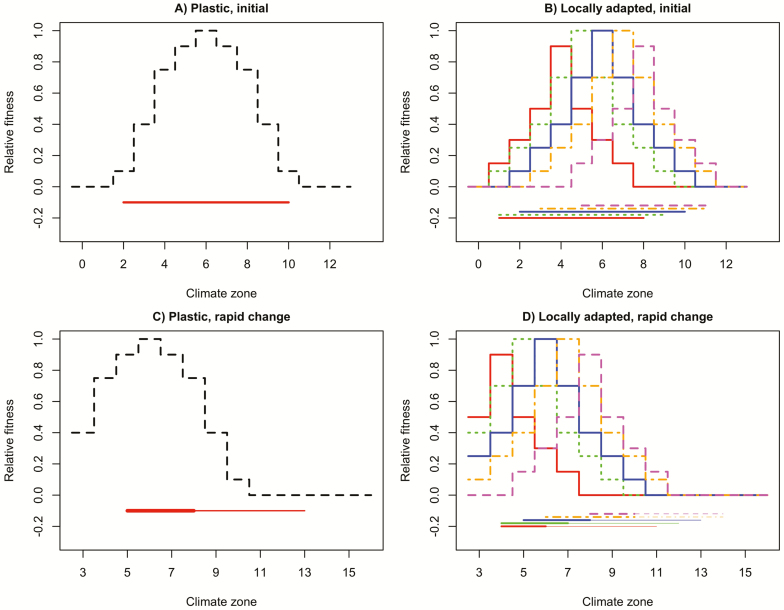
Figure 1.
(A) Dashed black curve depicts fitness across climate zones for a hypothetical plastic species, horizontal red line the area that species might occupy on the landscape. (B) Coloured curves depict fitness across climate zones for each of five populations in a locally adapted species. Horizontal coloured lines depict area of landscape each population could occupy in the absence of competition from other populations. (C) Dashed black curve depicts fitness across climate zones for plastic species after a period of rapid climate change. Horizontal red line depicts the original range, with areas where fitness increases drawn thick and areas where fitness decreases drawn thin. (D) Coloured curves depict fitness across climate zones for each of five populations after rapid climate change. Horizontal coloured lines depict the original range, with areas where fitness increases drawn thick and areas where fitness decreases drawn thin.

