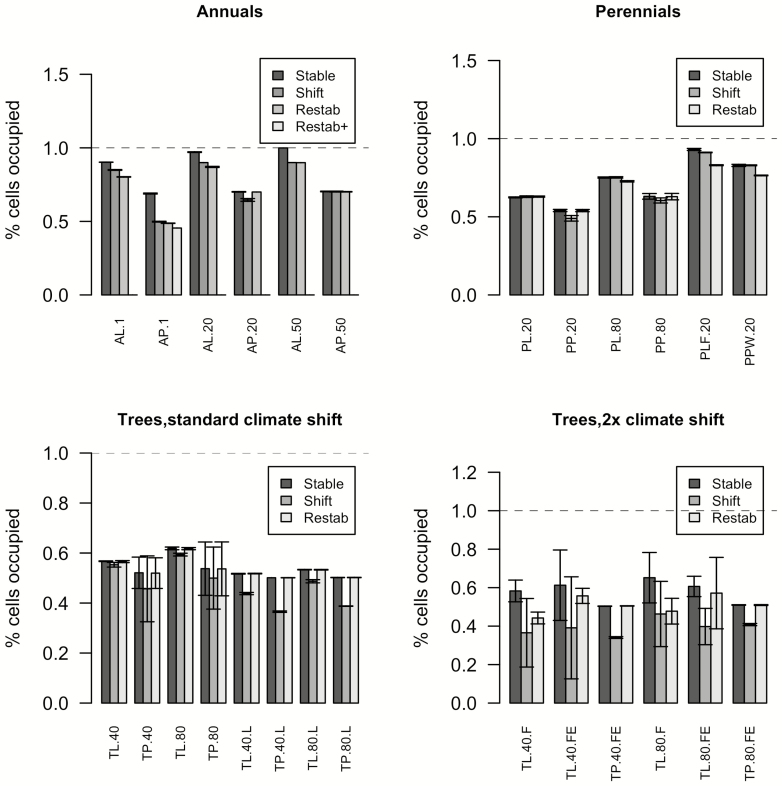
Figure 4.
Percent of landscape occupied after initial stabilization period (‘Stable’), at the end of the period of climate change (‘shift’) and after the restabilization period (‘Restab’). AL = annual, locally adapted; AP = annual, plastic; PL = perennial, locally adapted; PP = perennial, plastic; TL = tree, locally adapted; TP = tree, plastic. Numbers following these codes indicate average dispersal distance in meters. (Top left panel) For AP.1, the plastic annual with 1 m dispersal, a restabilization period 10× as long was tested in one run (‘Restab+’). (Top right panel) Variants for perennial species include PLF (a locally adapted with half the annual fitness impacts of climate) and PPW (widely plastic). (Bottom left) Trees on standard landscape or on landscape where climate bands are 4× as wide (.L variants), in which the two coldest climate bands disappear by the end of the simulation. (Bottom right) Trees exposed to a faster climate shift on the steeper gradient landscape with either the standard setup (.F variants) or an extended landscape that ensures suitable climates do not run off the edge (.FE variants). Error bars show SD over four model runs.

