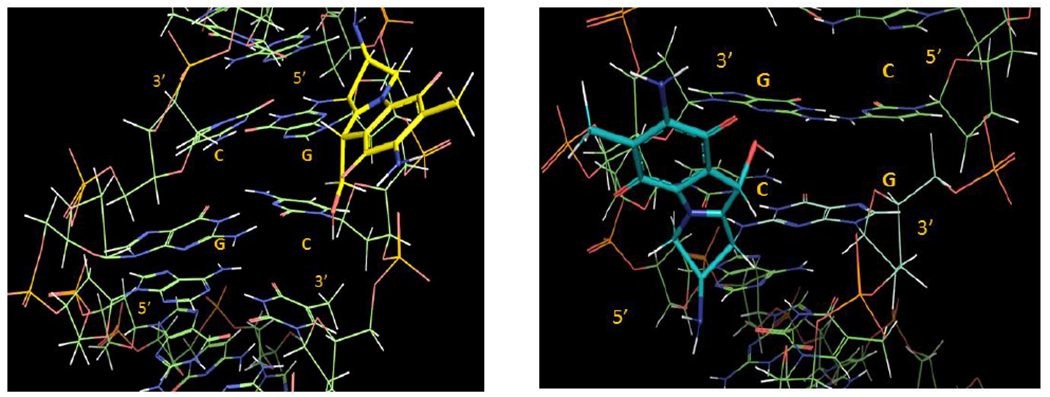
Figure 4.

3D representations of adduct 9b, left (9b is in yellow and in a 5’-GpC sequence context) and 9a, right (9a is in blue and in a 5’-CpG sequence context). The DNA segments under view are centred around the mitomycin complexation site and involve the d(AG[9b]CT).d(AGCT) (left) and d(ACG[9a]GT).d(ACGT) (right) segments. For details about the molecular modelling protocol see supporting information section S8.
