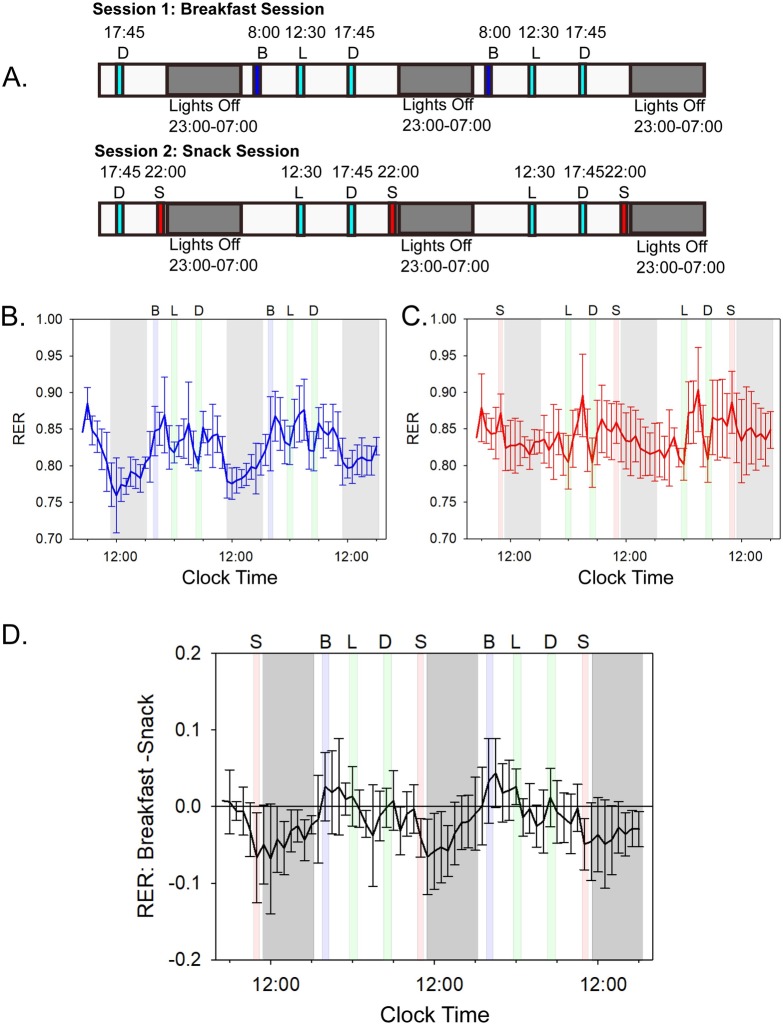
Fig 1. Chamber schedule and the impact of meal timing on subjects’ RERs.
See S3 Fig and S2A Table and S1 Data for underlying data and analyses. (A) Protocol for "Breakfast" Session versus "Snack" Session. Subjects experienced two separate 56-h continuous sessions with constant metabolic monitoring by indirect calorimetry, each session lasting 56 h. The Breakfast Session included a breakfast (B), lunch (L), and dinner (D), while the Snack Session contained a lunch, dinner, and late-evening snack meal (S). The late-evening snacks were of equivalent caloric and nutritional value to the breakfast meals (approximately 700 kcal; see S1 Table for details). Note from S2 Fig that the daily phasing of sleep for the subjects prior to entry into the metabolic chamber was the same as the "lights-off" interval during the 56-h time course, so the subjects did not experience a phase shift of their daily cycle when they entered the experimental conditions. (B) Breakfast Session: blue line indicates the average hourly RER over the entire 56-h time course among all 6 subjects when a breakfast, lunch, and dinner were presented. Error bars are the standard deviation. Letters indicate time and type of meals, and gray shaded areas indicate the lights-off periods. Green shaded areas indicate meals that were given at the same time in both Breakfast and Snack Sessions (lunch and dinner). Blue shaded areas indicate when breakfast was given, and gray shading indicates the lights-off period. See S3 Fig for data of all subjects individually. (C) Snack Session: the red line indicates the average hourly RER over the entire 56-h time course among all subjects when a lunch, dinner, and late-evening snack were presented. Red shaded areas indicate when late-evening snacks were given. Breakfasts and late-evening snacks contained the same number of calories and the same lipid, carbohydrate, and protein content (S1A and S1B Table). Error bars are the standard deviation (n = 6). (D) Average difference in RER over the entire 56-h time course for the Breakfast Session subtracted from the Snack Session. Deviation from zero (horizontal black line) indicates where differences in RER occurred between subjects. Error bars indicate standard deviation in the differences. In Panels B, C, and D, times of meals are indicated by letters (B = breakfast, L = lunch, D = dinner, S = late-evening snack), and gray areas are lights-off (sleep) intervals. Mealtimes are shaded as in panels A–C; breakfasts and snacks occurred only in their respective sessions. All RER data were collected minute by minute, and in this figure, the minute-by-minute data were binned and averaged for all 60 values within an hour. Abscissa are clock time. RER, respiratory exchange ratio.

