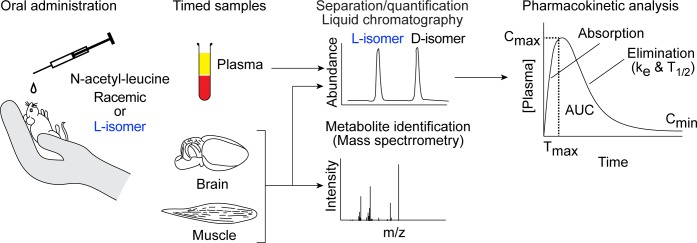
Fig 2. Schematic outlining the experimental procedure.
Male mice were orally administered N-acetyl-leucine as either the racemate (50% each enantiomer) or purified L-enantiomer (2.6% D-enantiomer and 97.4% L-enantiomer). At specific times (0.25 to 8 h) after administration, blood was taken, plasma was separated and quantified by chiral liquid chromatography/mass spectrometry. Plots of the plasma concentration of each enantiomer over time were used to visualize pharmacokinetics and a noncompartmental model was used to calculate the pharmacokinetic parameters Cmax (maximum peak concentration), Tmax (time to reach Cmax), ke (first order elimination rate constant), T1/2 (half-life) and AUC (area under the curve). Samples of brain and skeletal muscle were also taken at specific times and used to determine compound distribution and to search for metabolites with high-resolution mass spectrometry.

