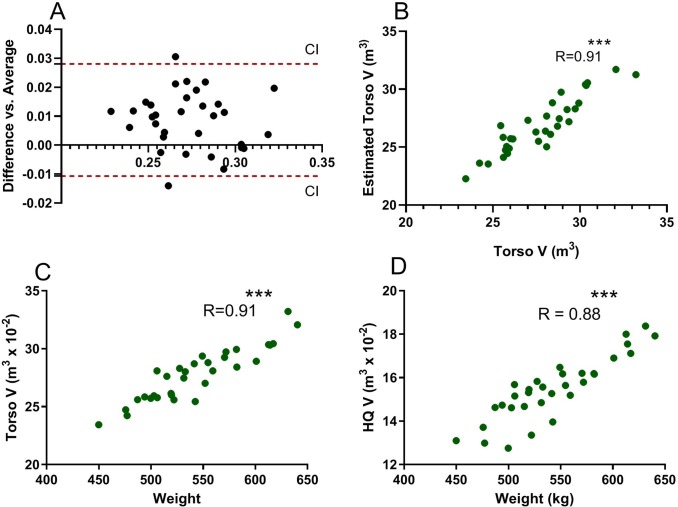
Fig 3. Accuracy of 3D scanning to assess body volume.
A. Bland Altman plot comparing the differences between torso V and average of estimated torso volume (V) with 95% confidence intervals depicted by red dashed lines. Only two of 32 V measures were outside of the 95% confidence limits. B. Correlation of 3D scan torso V with estimated torso V (R = 0.91). C. Positive correlation of 3D scan torso volume with body weight. D. Positive correlation of 3D scan hindquarter volume with body weight. ***P<0.001.

