
Figure 1.
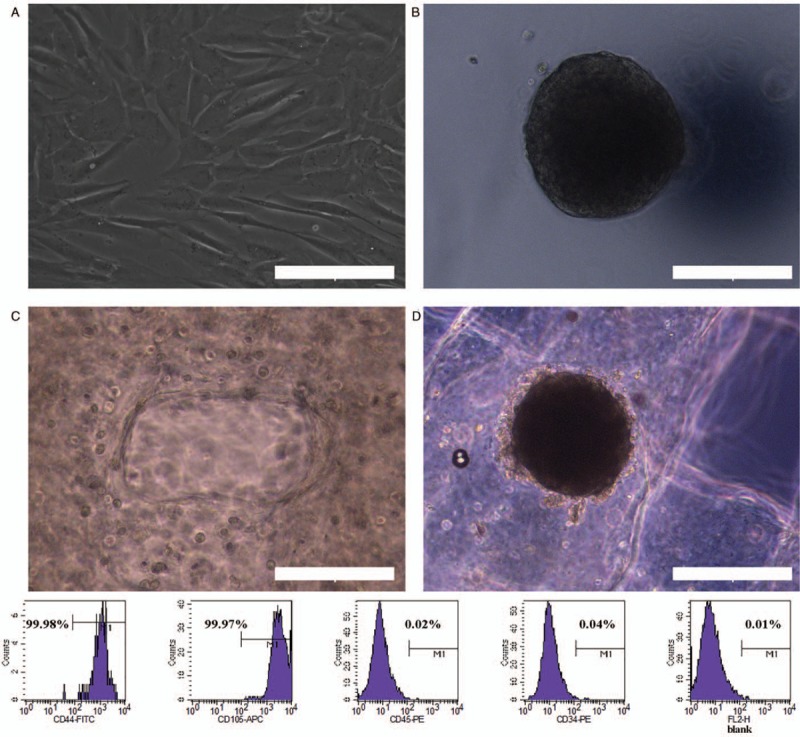
General inspection of hADSCs and MTs and identification of hADSCs. (A) Phase contrast microscopy showing the morphology of hADSCs. (B) Morphology of MTs. (C) Morphology of hADSCs after the bioprinting process. (D) Morphology of MTs after the bioprinting process. Scale bar = 200 μm. Bottom: Flow cytometry analysis of hADSCs surface phenotype. CD44 and CD105 were positive while CD45 and CD34 were negative. The percentage of positive cells is indicated in the figure. hADSCs: Human adipose-derived stem cells; MTs: Microtissues.