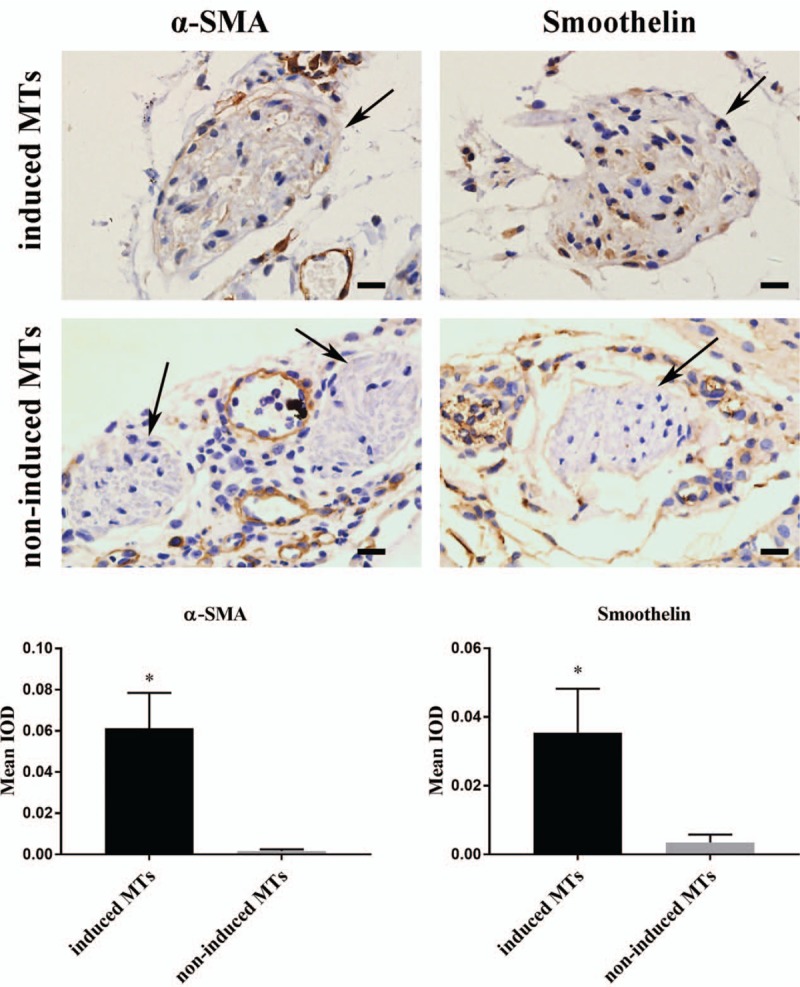
Figure 7.

Immunohistochemistry and semi-quantitative analysis for the discovery of smooth muscle biomarkers in MTs. Top: Immunohistochemistry staining of α-SMA and smoothelin in non-induced and induced MTs. Bottom: Both α-SMA and smoothelin were expressed in induced MTs after 7 days of subcutaneous implantation, and non-induced MTs had little expression of these smooth muscle markers. Bottom: Semi-quantitative analysis indicated statistical significance in the difference in smooth muscle marker expression between induced and non-induced MTs. Scale bar = 20 μm. ∗P < 0.05, comparison between induced MTs and non-induced MTs. IOD: Integral optical density; MTs: Microtissues; α-SMA: α-Smooth muscle actin.
