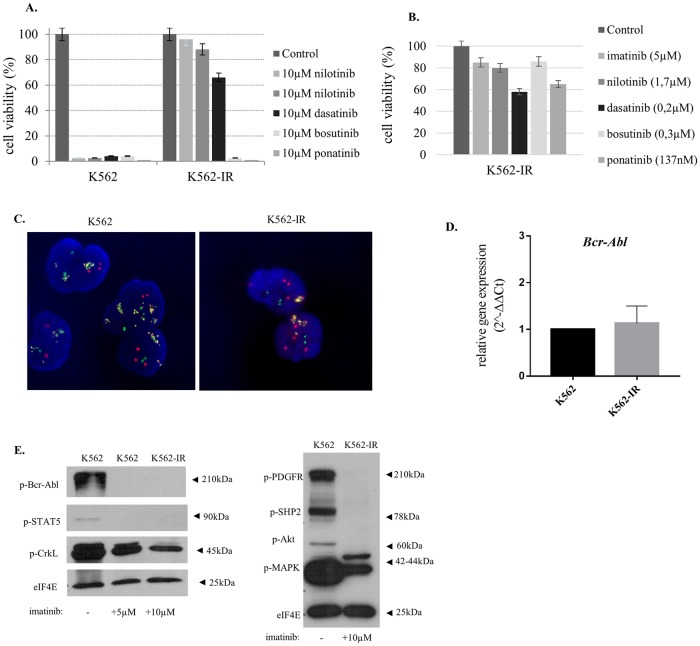
Fig 1. K562-IR cells are resistant to TKIs and do not conform to known TKI resistance mechanisms.
A. Cell viability of K562 and K562-IR cell treated with 10μM TKIs B. Cell viability of K562-IR cells treated with Cmax (daily clinical dose) concentrations. Flow cytometry analyses results were shown in the S1 Results of S1 Fig. Cells were treated with TKIs for 24, 48 and 72h followed by trypan blue staining and flow cytometry analyses for assessing cell viability. Only 72h results are presented. Viability was measured by counting live cells via hemocytometer after staining. Non-TKI treated cells were used for normalizing viability percentages. C. FISH analysis of K562 and K562-IR cell lines. Randomly selected 300 cells were analyzed for Bcr (green), Abl (red) and fusion (yellow) signals and amplification feature (cluster/disperse). The comparison of the two cell lines showed no significant difference. D. BCR-ABL q-RT-PCR gene expression levels revealed no significant difference between two cell lines (p>0.05) (n = 3 biological, 2 technical replicates in each). E. BCR-Abl and PDGFR pathway Western Blot analysis. Activation of proteins involved in BCR-Abl and PDGFR signaling pathway was studied using phospho-antibodies cocktails. eIF4E is loading control. BCR-Abl pathway was studied in cell lysates of K562, K562 grown in complete media supplemented with 5μM imatinib for 24h and K562-IR cells which were continuously incubated in complete media with 10μM imatinib. PDGFR pathway was studied using lysates of K562 as control and K562-IR cell which were continuously incubated in complete media with 10μM imatinib. Imatinib inhibits effectively BCR-Abl and PDGFR signaling in the K562-IR cells. Full-length blots and visualisation are presented in, S1 Raw image.

