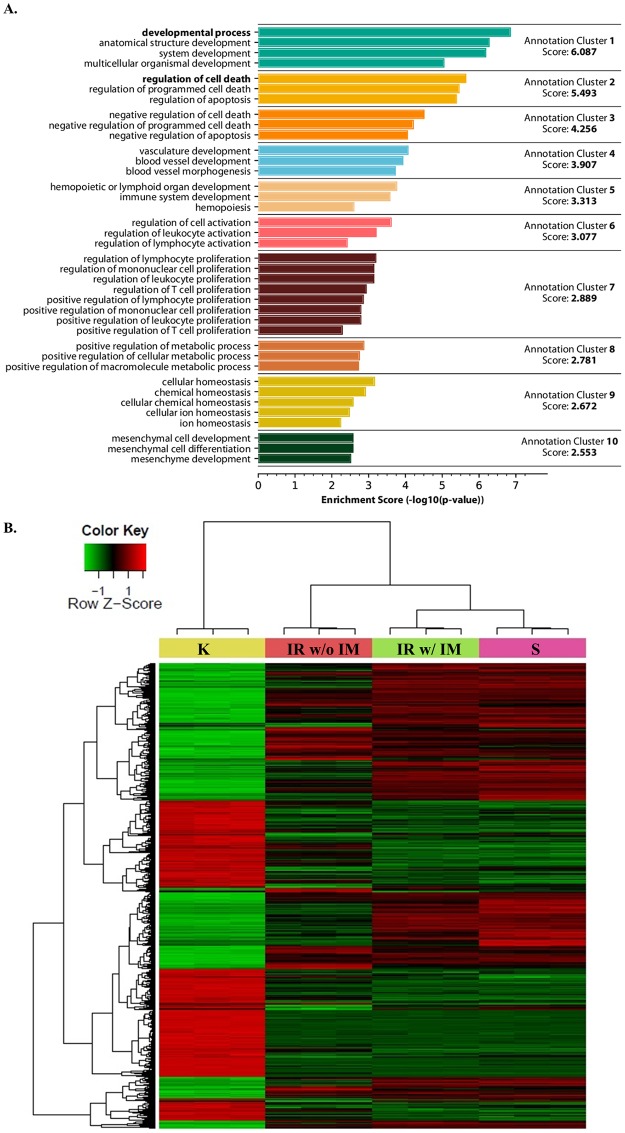
Fig 6. Gene Ontology and heatmap analysis of transcriptome data.
A. Functional annotation cluster analysis based on Gene Ontology (GO) Biological Process (BP) terms. Analysis was performed using DAVID 6.7 database for differentially expressed genes (FDR < 0.05 and fold change > 2 or < 2) of IR w/ IM vs. K comparison. B. Heatmap generated from triplicate microarray analyses of differentially expressed genes considering a FDR adjusted p-value less than 0.05 as statistically significantly changed. Abbreviations: “K”, K562 cells incubated in complete media; “IR w/o IM”, floating K562-IR cells in suspension incubated in complete media without imatinib for four weeks; “IR w/ IM”, floating K562-IR cells in suspension continuously incubated in complete media with 10μM imatinib; “S”, spindle-shaped K562-IR cells continuously incubated in complete media with 10μM imatinib.

