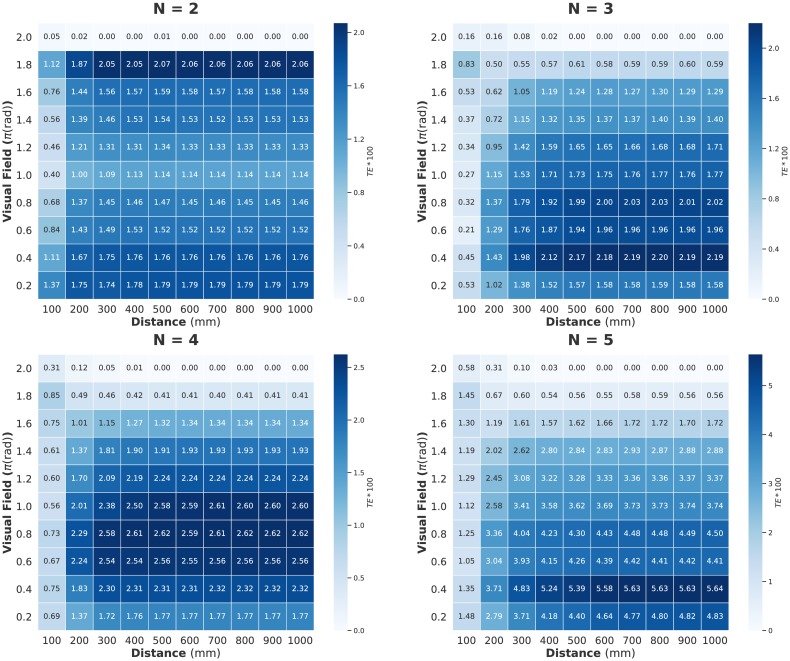
Fig 4. Heat maps showing the sum of transfer entropy (TE) for distance (horizontal axis) and visual field (vertical axis) parameter values.
Each cell value corresponds to the average TE on all samples. Note that each TE value is multiplied by 100 for contrast). The distribution of TE resembles that of MI. In contrast, TE does not become larger than the observed MI. This is because each pairwise information transfer in large groups is less than those of small groups. The time step is Δt = 0.05 s.

