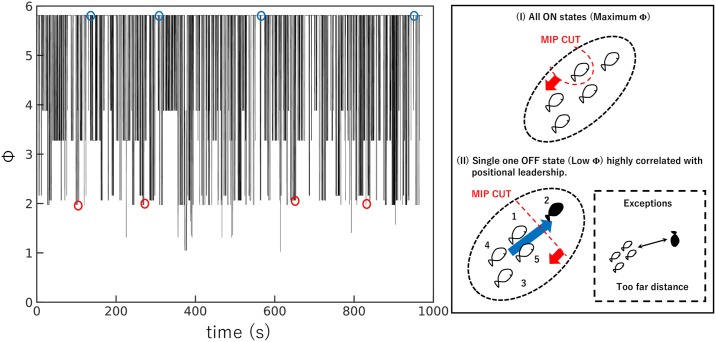
Fig 6. Example of a time series of Φ obtained from real fish data (N = 5).
The reduction of Φ at various points indicates where leadership emerges in the group. The local parameter settings are distance = 700 mm, visual field = 1.6π rad, and turning rate = 0 rad/s, respectively. The illustrations on the right represent the example state of the fish (white: ON, black: OFF) and their minimum information partition (MIP). The blue circles on the left plot correspond to formation I on the right. The red circles on the left figure correspond to formation II on the right. This figure represents the cases where the positional leader (index 2) matches a single OFF state individual. The thick blue arrow is the average direction of the group. The dashed square indicates an exception, where a single OFF state individual is not the positional leader (this situation is rare: see Table 3). To enable interested readers to compute Φ using PyPhi, we list the transition probability matrix (TPM) in S1 Table.

