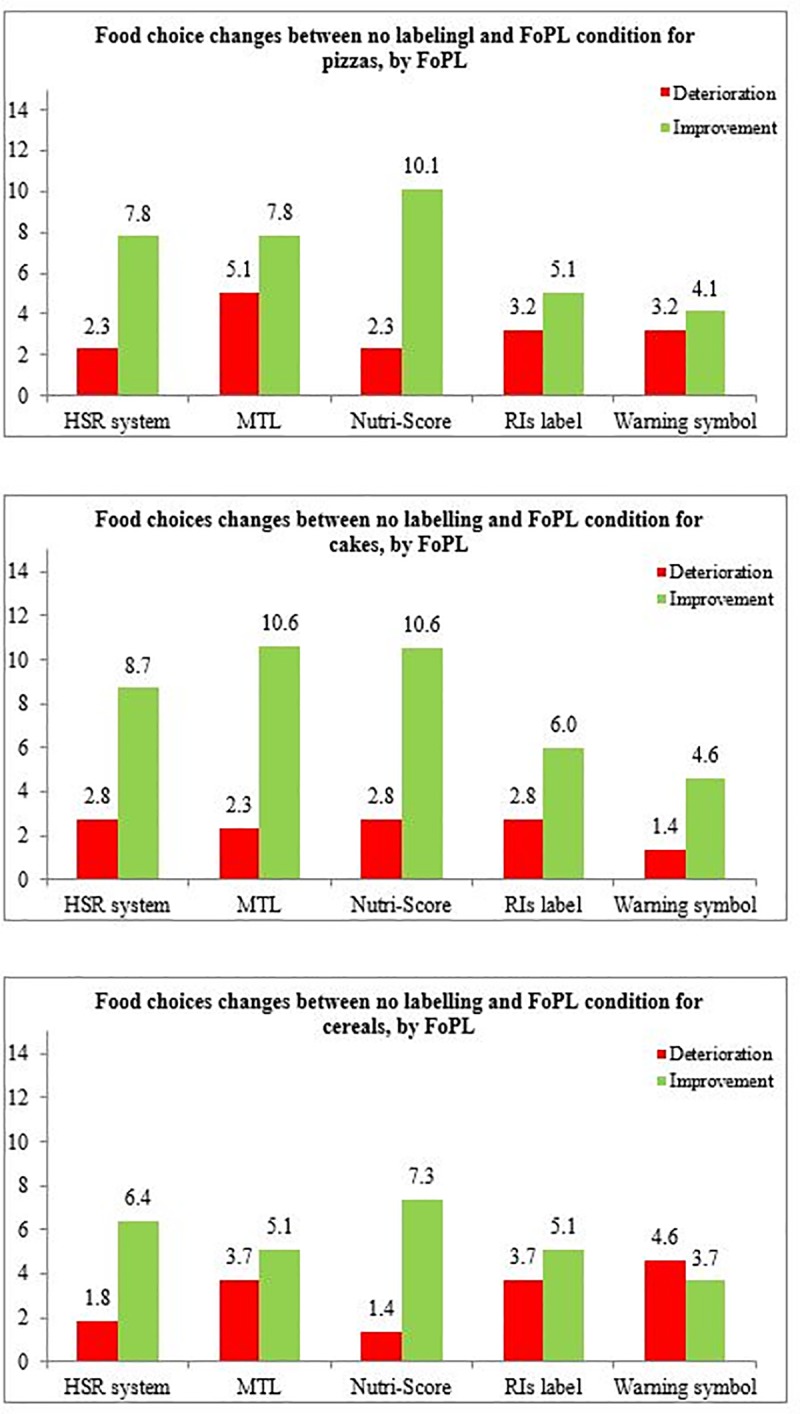
Fig 3. Percentages of deterioration and improvement of the nutritional quality of food choices, by FoPL type and food category.

Associations between FoPL type and food choices are displayed in Table 2. The Nutri-Score was the only FoPL to demonstrate a significant effect on the improvement of the nutritional quality of food choices compared to the RIs label. This occurred overall (OR = 1.83[1.17–2.86], p-value = 0.008) and among pizzas (OR = 1.90[1.01–3.57], p-value = 0.05).
