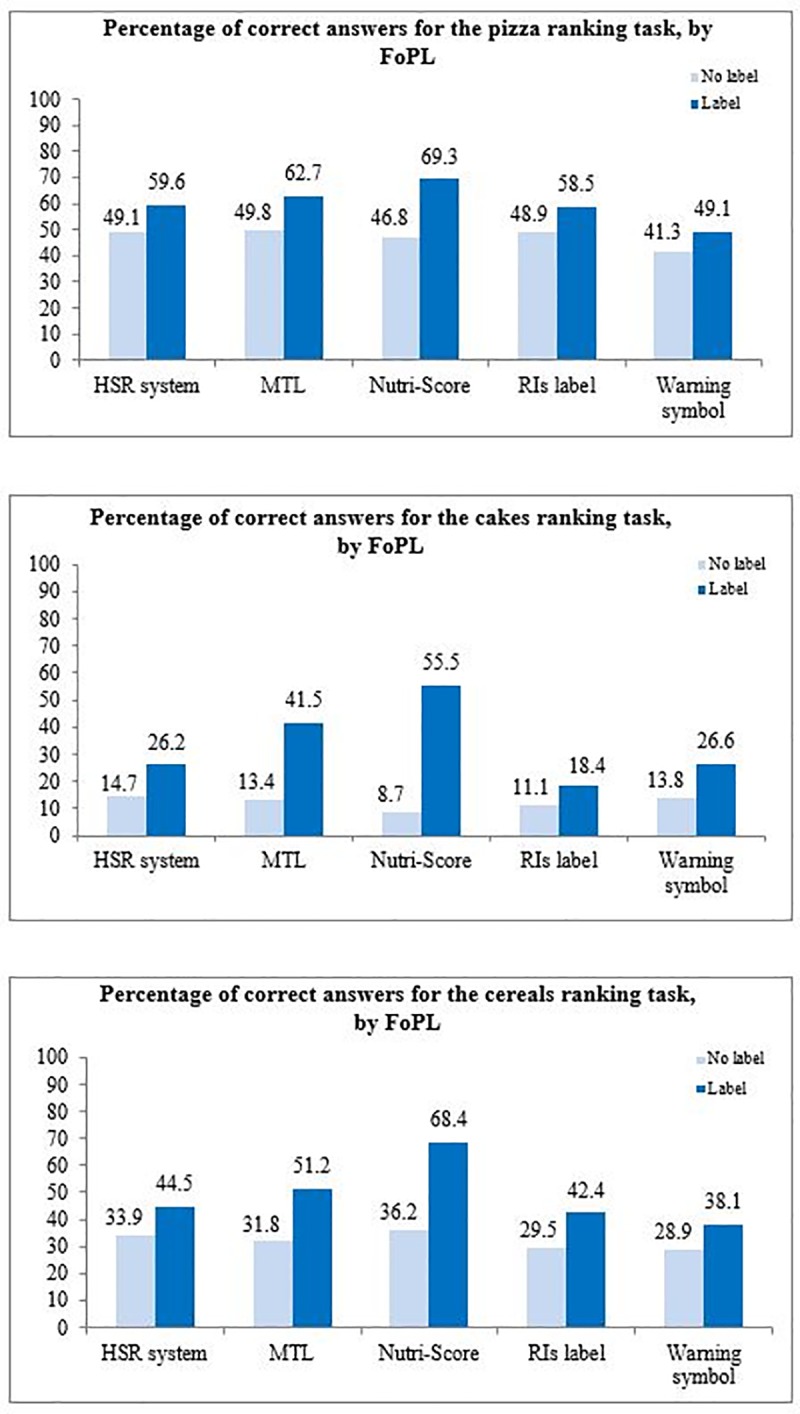
Fig 4. Percentage of correct answers for ranking tasks, by FoPL and food category.

Associations between FoPL type and ability to correctly rank products are presented in Table 3. Overall, the Nutri-Score was the label leading to the greatest improvement in ability to correctly rank products according to their nutritional quality compared to the RIs (OR = 4.02[2.81–5.75] (p-value<0.0001), followed by the MTL (OR = 2.09[1.46–2.99], p-value<0.0001) and the Warning symbol (OR = 1.52[1.05–2.18], p-value = 0.03). When analyses were performed by food category, the Nutri-Score showed higher performances among the three categories, and was notably the only FoPL to show significant improvements compared to the RIs label among pizzas and breakfast cereals. Among cakes, the performance of the Nutri-Score was followed by the MTL, the Warning symbol and then the HSR.
