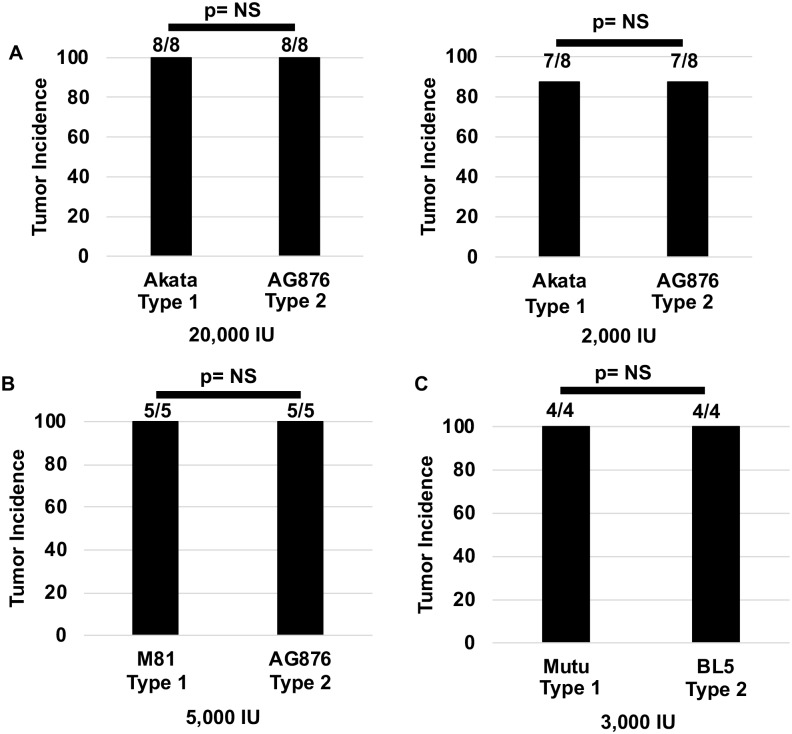
Fig 1. T2 EBV infected CBH mice develop tumors at a similar frequency as T1 EBV infected mice.
A) The proportion of CBH mice that developed tumors after injection with 20,000 or 2,000 infectious units of either T1 Akata or T2 AG876 is shown. Two experiments were performed using both doses with two different donors. B) The proportion of CBH mice that developed tumors using 5,000 infectious units of T1 M81 or T2 AG876. C) The proportion of CBH mice developing tumors using 3,000 infectious units of T1 Mutu and T2 BL5 viruses. Fisher’s exact test was performed to determine if tumor frequency rates were significantly different between the different conditions.

