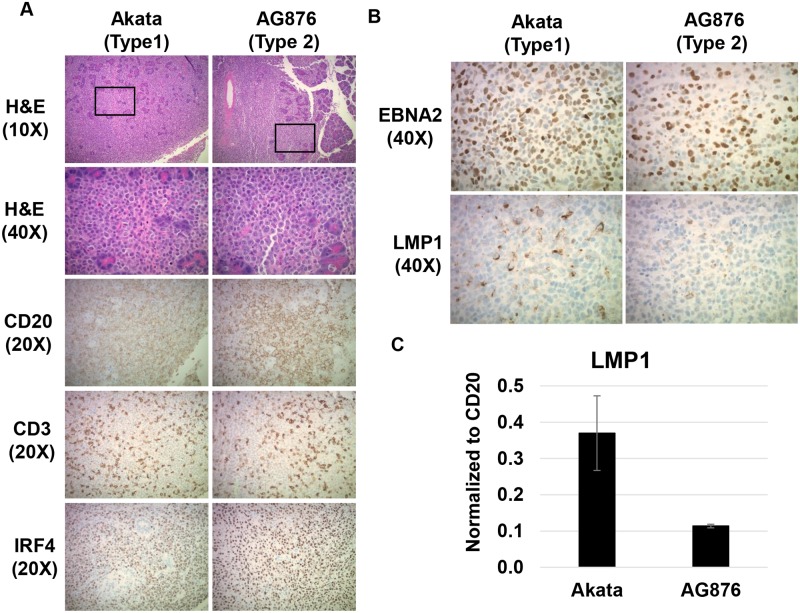
Fig 2. T2 EBV induces activated DLBCLs that are in Type III latency but express less LMP1 than T1 EBV-induced lymphomas.
A) H&E staining was performed on T1 and T2 EBV-induced lymphomas, each invading the pancreas. IHC analysis was performed using antibodies against CD20 (B cell marker), CD3 (T cell marker) and IRF4 (maker of activated DLBCLs) as indicated. B) IHC analysis of T1- and T2-induced lymphomas using antibodies against EBNA2 (EBV latency protein) and LMP1 (EBV latency protein) as indicated. C) qPCR analysis of RNA isolated from T1 and T2 EBV-induced lymphomas using primers that recognize both T1 and T2 LMP1 genes; results were normalized to the level of the cellular B-cell specific CD20 transcript.

