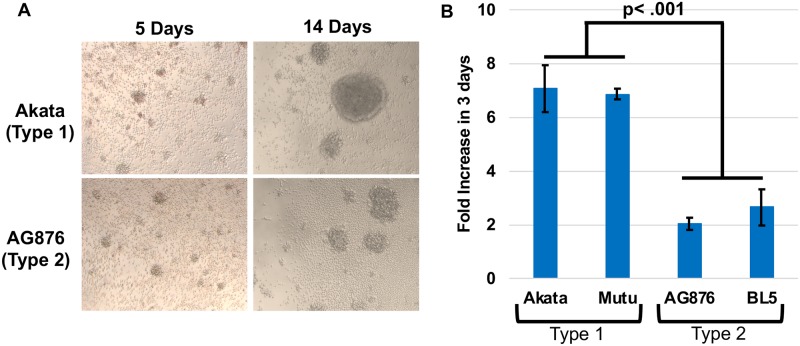
Fig 5. T2 EBV-infected LCLs proliferate at a reduced rate compared to T1 EBV- infected LCLs.
A) Light microscopy images of T1 and T2 EBV-infected B cells at 5 days and 14 days post infection are shown. B) T1 and T2 EBV-infected LCLs were counted 3 days after diluting cells to 1x10^5 cells per mL. The fold increase in cell count was determined by comparing counts at 72 hrs to initial cell number using trypan blue staining. Experiments were performed using three different LCL clones and clones were counted in duplicate. Wilcoxon-Rank Sum Test was performed comparing Type 1 LCLs versus Type 2 LCLs. A p-value < .05 is considered significant.

