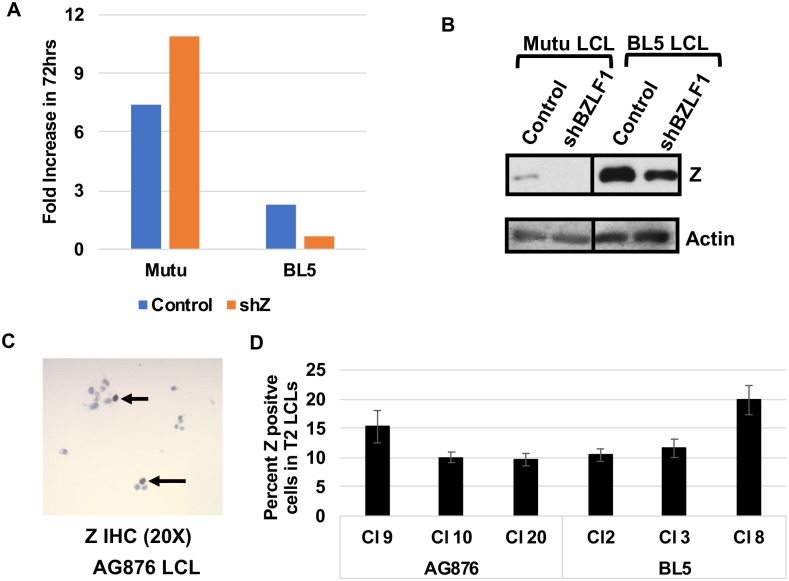
Fig 7. Lytic infection in T2 EBV-infected LCLs does not reduce growth rate.
A) T1 EBV-infected (Mutu) or T2 EBV-infected (BL5) LCLs stably infected with control shRNA or shRNAs targeting Z were diluted to 1x10^5 cells and counted 72 hours later. The fold increase in cell number was determined by comparing cell counts at 72 hours to initial cell number. Experiment was performed in triplicate. B) Immunoblot analysis of BL5 LCLs or Mutu LCLs infected with either control shRNA or shRNA targeting Z using antibodies against Z and actin. C) IHC analysis of T2 LCLs was performed using antibody against Z. Arrows indicated Z staining cells. D) Quantification of the percent of EBV-infected cells in type 2 LCLs expressing Z as determined by IHC analysis. At least 10 fields of view were quantified across 3 independently derived Type 2 LCL clones infected with either the AG876 or BL5 viruses.

