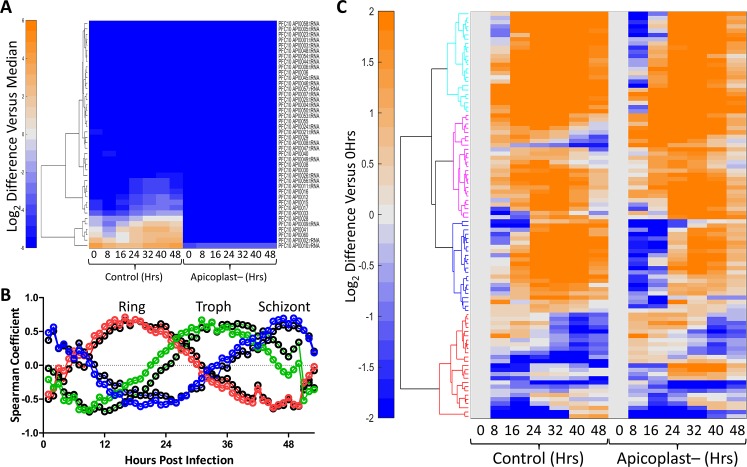
Fig 7. Transcriptomic analysis of apicoplast-disrupted parasites.
A) Hierarchical clustering of apicoplast genome expression from control and apicoplast-disrupted parasites during the IDC. The apicoplast gene expression data were normalized by the median expression of 5851 genes from corresponding parasites at each time point before performing the clustering. We used Euclidean distance measure, along with Ward’s method, to create the hierarchical clusters in MATLAB. The expression profile of the apicoplast genes from the apicoplast-disrupted parasites is minimal confirming that the organelle is missing. The values are shown on a log2 scale. B) Spearman coefficient values were calculated by comparing the global transcriptional data generated from control (black circles) and apicoplast disrupted (colored circles) parasites at the indicated time points against corresponding data from each time point generated in the high-resolution 3D7 IDC transcriptome from Llinás and coworkers [39]. The y-axis shows Spearman coefficient; the x-axis shows hours post invasion in the IDC data set. The apex of the peak in each graph corresponds to the approximate point in the IDC to which apicoplast-disrupted parasites best correlate at the indicated incubation time. Plots are shown with a Loess fit of the data: 16hrs (red), 32hrs (green), and 48hrs (blue). C) Hierarchical clustering of transcriptomic data, of 96 high-confidence apicoplast genes, from control and apicoplast-disrupted parasites at the indicated time points. The expression profile of each gene was normalized by its expression at time point 0 to visualize variation in their temporal profile, in response to apicoplast disruption. Four distinct clusters are shown (cyan, magenta, blue, and red) and are further described in S3 Fig. The clustering method used here is identical to that described for A).

