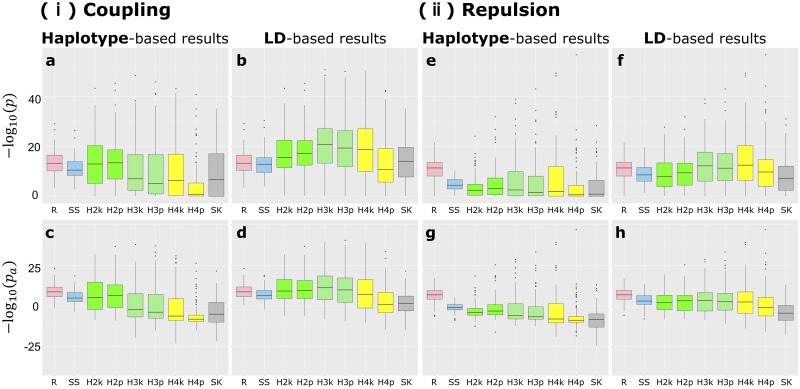
Fig 1. The detection power of each GWAS method.
Boxplot of the detection power evaluated by −log10(p) and −log10(pa). a-d: The results for the “coupling” scenario. e-h: The results for the “repulsion” scenario. a,b,e,f: The results evaluated by −log10(p) with the scale on the vertical axis aligned in these four figures. c,d,g,h: The results evaluated by −log10(pa) with the scale on the vertical axis aligned in these four figures. a,c,e,g: The results evaluated by the unit of the causal SNP or haplotype block itself. b,d,f,h: The results evaluated by the unit of the regions within the extent of LD. The abbreviation of each method is as follows. R: RAINBOW. SS: Single-SNP GWAS. H2k-H4p: HGF methods. The numbers in the method names correspond to the numbers of the groups they assume. The last letters of the methods are “k” or “p”. “k” corresponds to the k-medoids method and “p” corresponds to UPGMA method for the grouping method. SK: SKAT.

