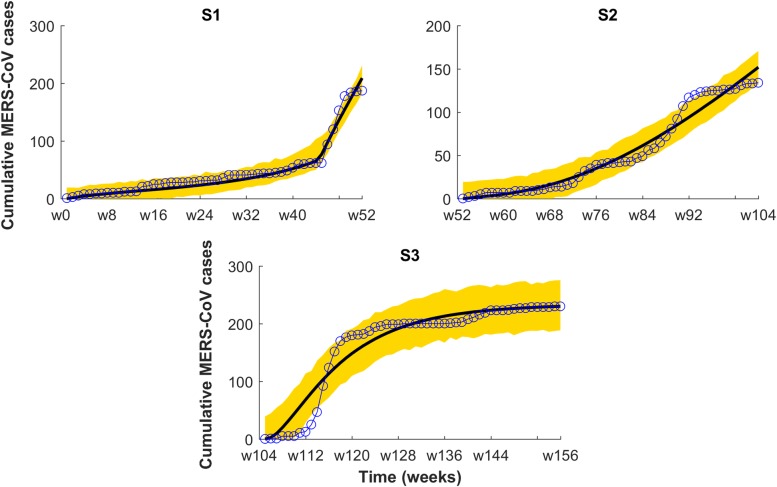
Fig 8. Season-wise model fitting to cumulative cases of Riyadh from July 6, 2013 to June 28, 2016.
(Model fitted is a 2-strain model with saturated incidence. One year appears in each panel S1 to S3(S1 = S2 = S3 = 52 weeks). Line and circle line refers to observations and 95%confidence interval for cumulative predictions denoted by the yellow region.

