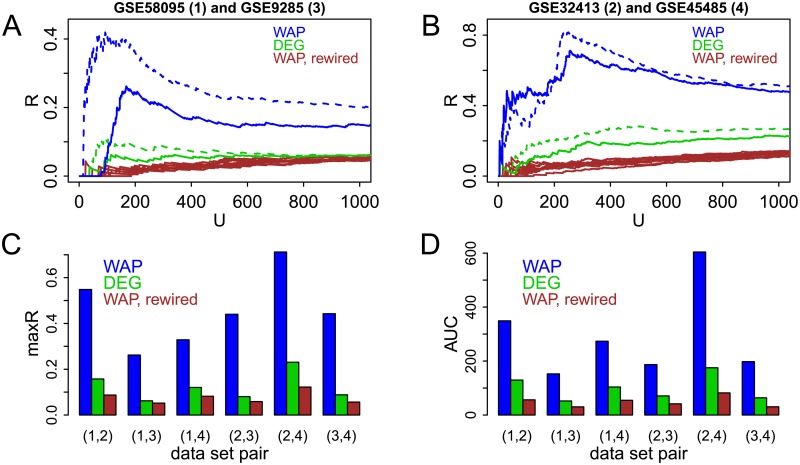
Fig 4. Reproducibility of WAPs and DEGs among four SSc data sets.
Four gene expression data sets comparing skin samples between SSc patients and non-SSc subjects—GSE58095 (1), GS32413 (2), GSE9285 (3) and GSE45485 (4)—are used to obtain WAP and DEG scores. Blue and green colors represent overlaps between top scoring WAPs and DEGs respectively. A-B: Overlap profiles for two pairs of data sets. Solid profiles correspond to genes ordered by a two-sided t-test and dashed profiles—to ordering which further accounts for fold change (a gene rank is the average of its t-statistic and fold-change ranks). Brown profiles display results for ten randomly rewired protein networks. C-D: Overlap statistics maxR and AUC for all six data set pairs, when genes are ordered by a two-sided t-test. For randomly rewired networks, displayed values are averages.

