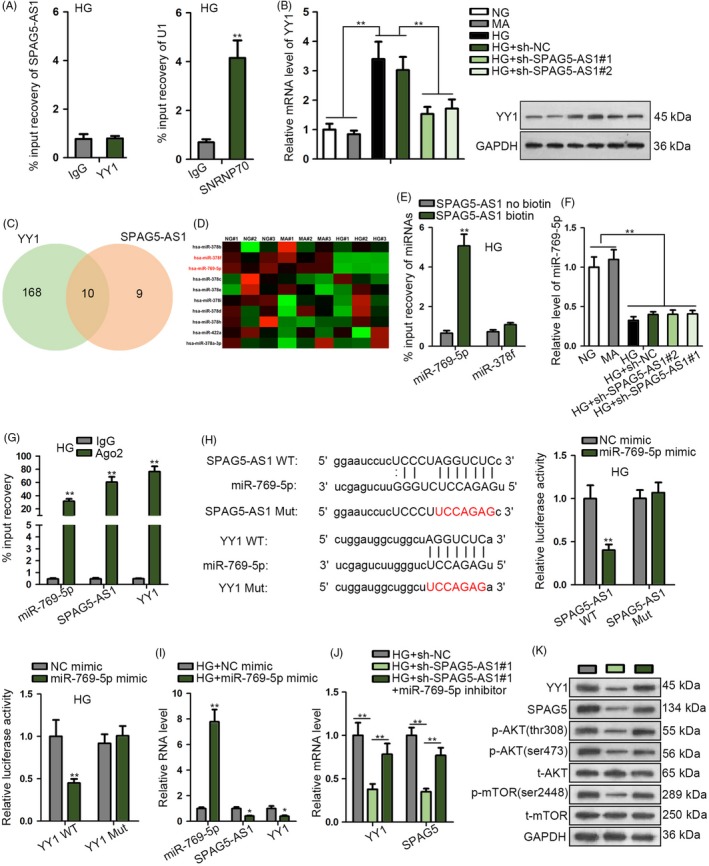
Figure 5.

SPAG5‐AS1 induced SPAG5 level through acting as a ceRNA regulating miR‐769‐5p/YY1. A, RIP analysis showed the non‐existence of SPAG5‐AS1 in the YY1 precipitates in HG‐treated HPCs. SNRNP70 and U1 were positive controls. B, YY1 mRNA and protein levels in HPCs treated with NG, MA, HG, HG + sh‐NC or HG + sh‐SPAG5‐AS1#1/2. C‐D, 10 miRNAs potently shared by YY1 and SPAG5‐AS1 were showed as Venn diagram and subjected to RT‐qPCR analysis under the treatment of HG compared to HG and MA in HPCs. E, RNA pull‐down assay was applied for the miR‐769‐5p enrichment in complex pulled down by SPAG5‐AS1 biotin probe or no‐biotin probe. F, MiR‐769‐5p level in each group after repressing SPAG5‐AS1 expression. G, RIP analysis was used to confirm the levels of miR‐769‐5p, SPAG5‐AS1 and YY1 in Ago2 precipitates. H, The wild‐type (WT) and mutant (Mut) binding sites of miR‐769‐5p on SPAG5‐AS1 and YY1 were utilized to conduct luciferase reporter assay to assess the luciferase activity of SPAG5‐AS1 WT and YY1 WT in HG‐treated HPCs after transfection with miR‐769‐5p mimic or NC mimic. I, Levels of miR‐769‐5p, SPAG5‐AS1 and YY1 in HPCs treated with HG + NC mimic or HG + miR‐769‐5p mimic. J, HG‐treated HPCs were transfected with sh‐NC, sh‐SPAG5‐AS1#1 or sh‐SPAG5‐AS1#1 + miR‐796‐5p inhibitor. RT‐qPCR data of the level of YY1 and SPAG5 mRNA of each group. K, Western blot of the protein levels of YY1, SPAG5, p‐AKT (thr308 and ser473) and p‐mTOR (ser2448) in HG‐treated HPCs with indicated transfection. All experiments were conducted in triplicates. Data are presented as mean ± SD. *P < .05, **P < .01
