Figure 1.

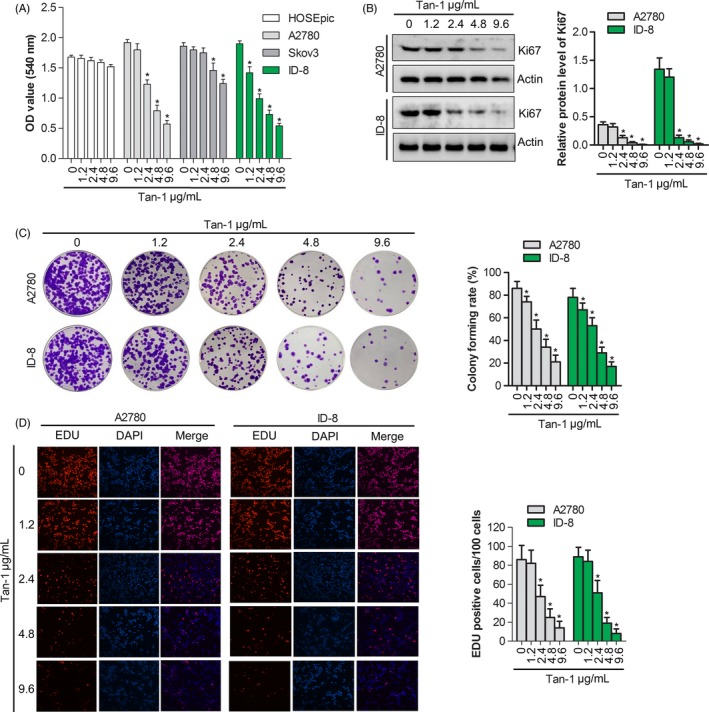
Tan‐Ⅰ inhibited proliferation and colony formation in ovarian cancer cell. A, Cells proliferation assay of human ovarian cancer cell lines A2780, Skov3 and ID‐8 cell after Tan‐Ⅰ treatment at 1.2, 2.4, 4.8 and 9.6 μg/mL for 24 h by CCK‐8 assay. Data are presented as the mean ± SD of three independent experiments. *P < .05. B, Ki67 protein expression in A2780 and ID‐8 cells after Tan‐Ⅰ treatment at 1.2, 2.4, 4.8 and 9.6 μg/mL for 24 h by Western blot. Data are presented as the mean ± SD of three independent experiments. *P < .05. C, Colony formation of A2780 and ID‐8 cells after Tan‐Ⅰ treatment at 1.2, 2.4, 4.8 and 9.6 μg/mL for 24 h. Data are presented as the mean ± SD of three independent experiments. *P < .05. D, Percentage of EdU‐positive cells of A2780 and ID‐8 cells after Tan‐Ⅰ treatment at 1.2, 2.4, 4.8 and 9.6 μg/mL for 24 h by EdU staining(×100). Data are shown as mean ± SD. *P < .05
