Figure 2.

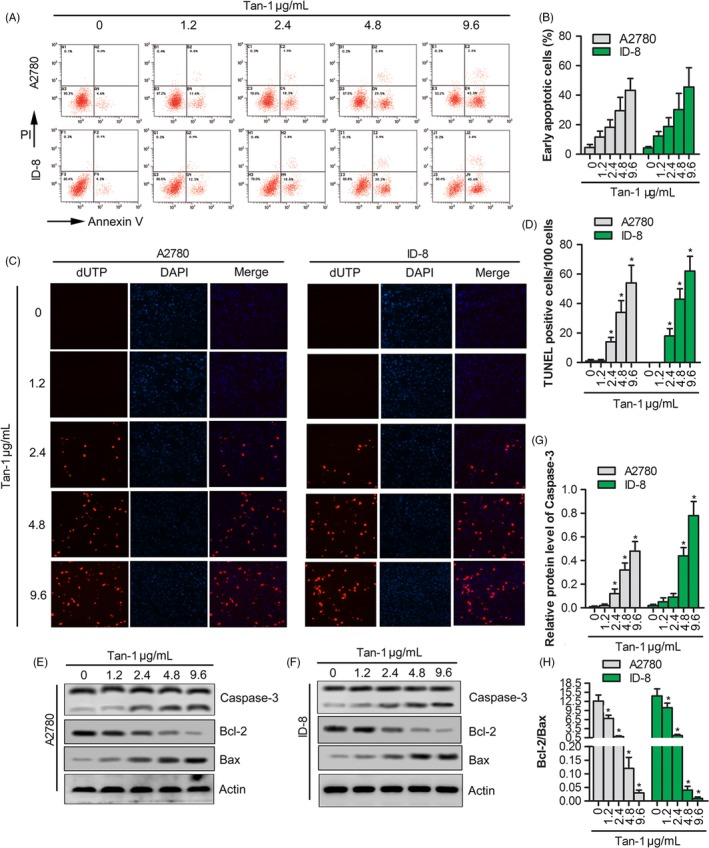
Tan‐Ⅰ induced the apoptosis by promoting Caspase‐3 cleavage. A, Apoptosis assay of A2780 and ID‐8 cells after Tan‐Ⅰ treatment at 1.2, 2.4, 4.8 and 9.6 μg/mL for 24 h by flow cytometer. B, Quantification of cell apoptosis in (A). Data are shown as mean ± SD. *P < .05. C, The apoptosis‐positive cells of A2780 and ID‐8 cells after Tan‐Ⅰ treatment at 1.2, 2.4, 4.8 and 9.6 μg/mL for 24 h by TUNEL staining(×100). D, Quantification of TUNEL‐positive cells in (C). Data are shown as mean ± SD. *P < .05. E and F, Apoptosis‐related protein expression (Caspase‐3, Bcl‐2 and Bax) in A2780 and ID‐8 cells after Tan‐Ⅰ treatment at 1.2, 2.4, 4.8 and 9.6 μg/mL for 24 h by Western blot. G, Quantification of Caspase‐3 activity in (E) and (F). Data are presented as the mean ± SD of three independent experiments. *P < .05. H, The ratio of Bcl‐2/Bax in (E) and (F). Data are presented as the mean ± SD of three independent experiments. *P < .05
