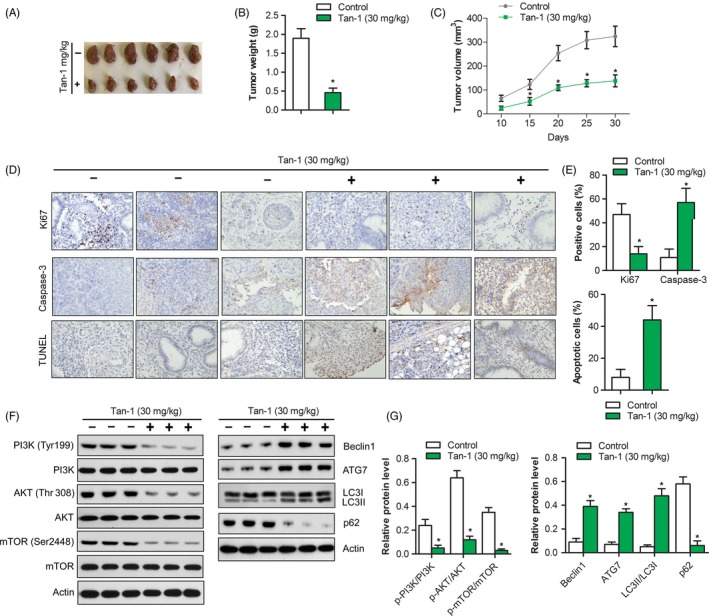
Figure 5.

Tan‐Ⅰ inhibited tumour growth in vivo. A, Tumours in control group and Tan‐Ⅰ 30 mg/mL group were isolated and pictured after 4 weeks’ treatment. B, Tumour weight was calculated in control group and Tan‐Ⅰ 30 mg/mL group. Data are shown as mean ± SD. *P < .05. C, Tumour growth curve in control group and Tan‐Ⅰ 30 mg/mL group. Data are shown as mean ± SD. *P < .05. D, Ki67 and Caspase‐3 protein expression in tumour tissues of control group and Tan‐Ⅰ 30 mg/mL group were analysed by immunohistochemistry(×40). Tumour cell apoptosis in control group and Tan‐Ⅰ 30 mg/mL group were analysed by TUNEL staining(×40). E, Quantification of protein expression and cell apoptosis in (D). Data are shown as mean ± SD. *P < .05. F, The protein expression of autophagy and PI3K/Akt/mTOR signalling pathway in control group and Tan‐Ⅰ 30 mg/mL group were detected by Western blot. n = 3. G, Quantification of protein expression in (F). Data are shown as mean ± SD. *P < .05
