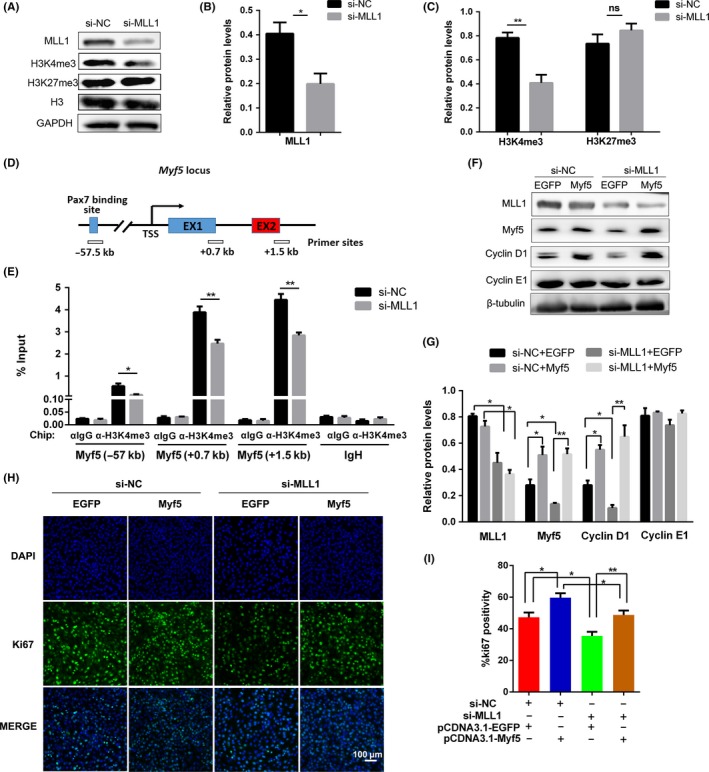
Figure 3.

MLL1 regulates Myf5 expression through H3K4me3 modification. A, Western blot detected the levels of MLL1, H3K4me3 and H3K27me3 in si‐MLL1 cells cultured in GM. GAPDH and histone H3 (H3) were used as loading control. B, The relative protein levels of MLL1 normalized to GAPDH signals in (A) were obtained through WB band grey scanning. C, The relative levels of histone H3K4me3 and H3K27me3 normalized to H3 signals in (A). D, Location of primer sets for ChIP‐qPCR analysis of Myf5 promoter. TSS: transcription start site. E, ChIP‐qPCR analysis of H3K4me3 enrichment on Myf5 promoter in si‐MLL1 cells. IgH enhancer region was used as a negative control. Data were normalized as a percentage of the input. F, C2C12 cells, cotransfected with si‐NC or si‐MLL1 and pcDNA3.1‐EGFP or pcDNA3.1‐Myf5 vector, were cultured in GM for 48 h. The protein levels of MLL1, Myf5 and Cyclin D1 in four groups were detected by Western blot. β‐tubulin was used as a loading control. G, The relative protein levels of target proteins normalized to β‐tubulin signals in (F). H, C2C12 cells were treated as indicated in (F), and Ki67 immunofluorescent staining was performed to compare cell proliferation ability between four experiment groups. Scale bar = 100 μm. I, The percentage of Ki67‐positive cells in (H) were counted in six microscopic fields for each group. Data are showed as mean ± SEM, n = 6 per group. *P < .05, **P < .01 (Student's t test)
