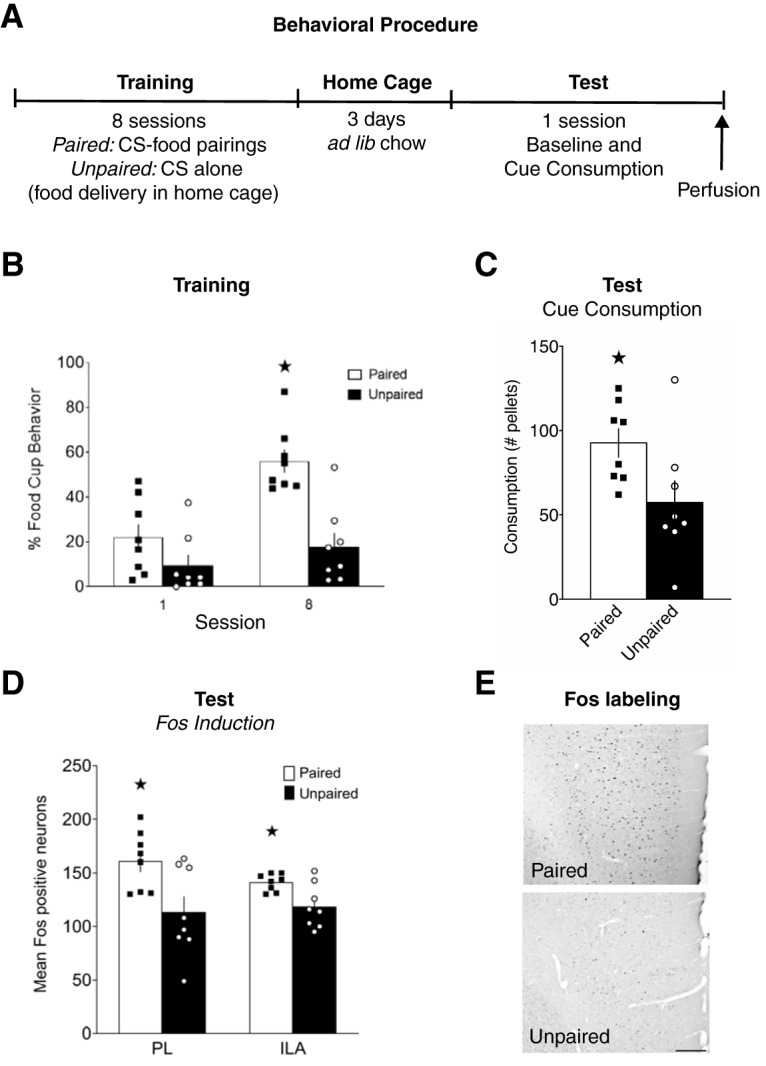
Figure 1.

Fos expression in mPFC during cue-potentiated feeding. A, Experimental design. B, Conditioned responses during the first and last training sessions. C, Food consumption during cue tests. D, Number of Fos-positive neurons in PL and ILA. E, Representative images of Fos labeling in PL, scale bar = 200 μm. B–D, Data are mean ± SEM. *p < 0.05.
