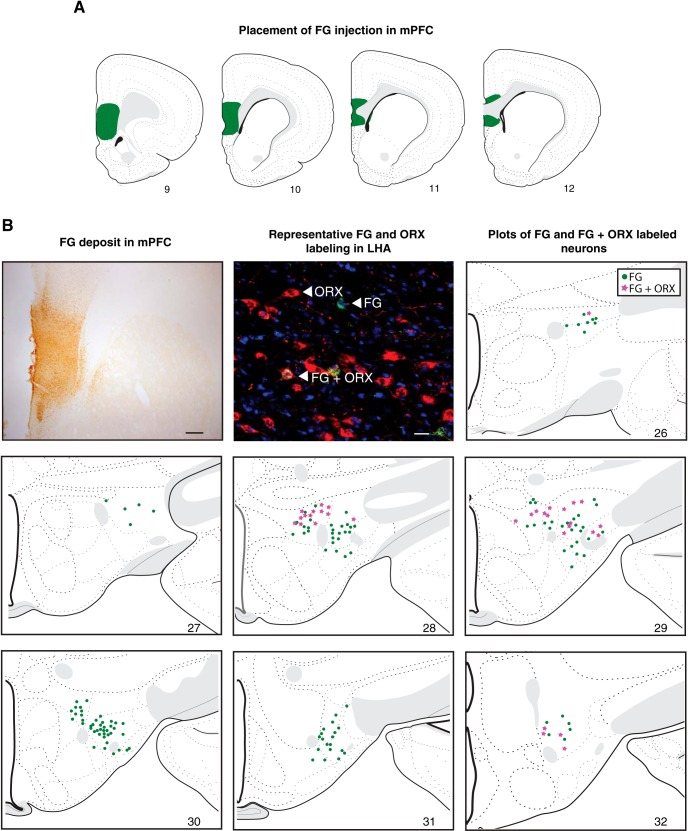
Figure 4.
LHA orexinergic projection to mPFC. A, Placement of FG injection in mPFC. B, A representative image of FG deposit in mPFC (first panel), scale bar = 100 μm. A representative image of FG and ORX labeling in LHA (second panel), scale bar = 25 μm. Plots of FG and FG + ORX labeled neurons, shown on modified atlas templates (Swanson, 2004). Green dots = FG-labeled neurons; Magenta = Double-labeled FG + ORX-positive neurons.

