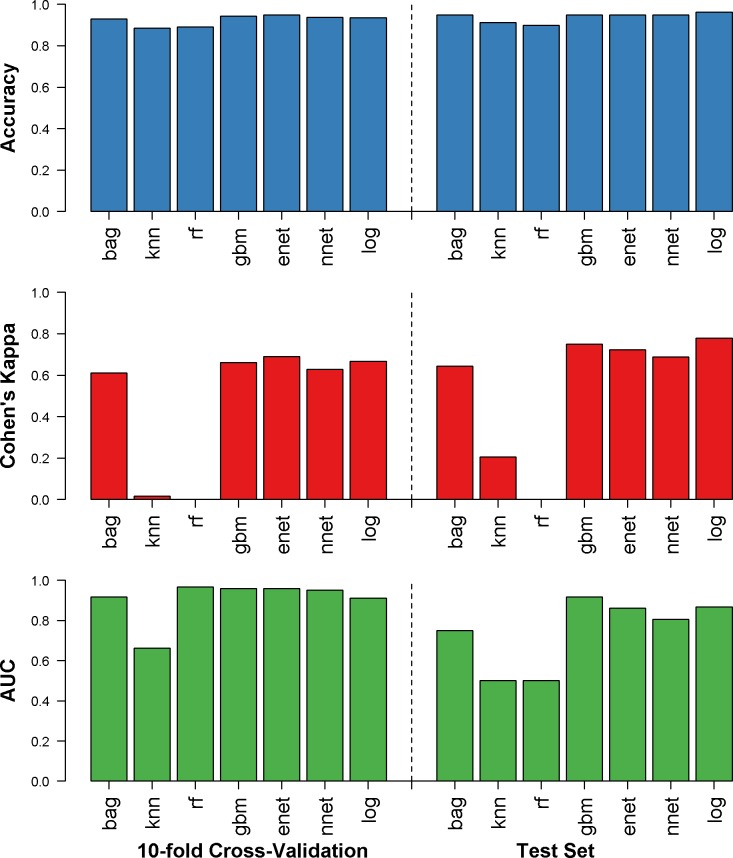
Fig 2. Results for SISA dataset.
Accuracy (blue), Cohen’s kappa (red), and AUC (green) were calculated for the repeated 10-fold cross validation (left) and the holdout test dataset (right) for prediction of hospitalization status in clinically diagnosed dengue, chikungunya or Zika virus infections. bag = bagged trees, knn = k nearest neighbors, rf = random forest, gbm = generalized boosting models, enet = elastic net, nnet = neural networks, log = logistic regression.

