Figure 5.
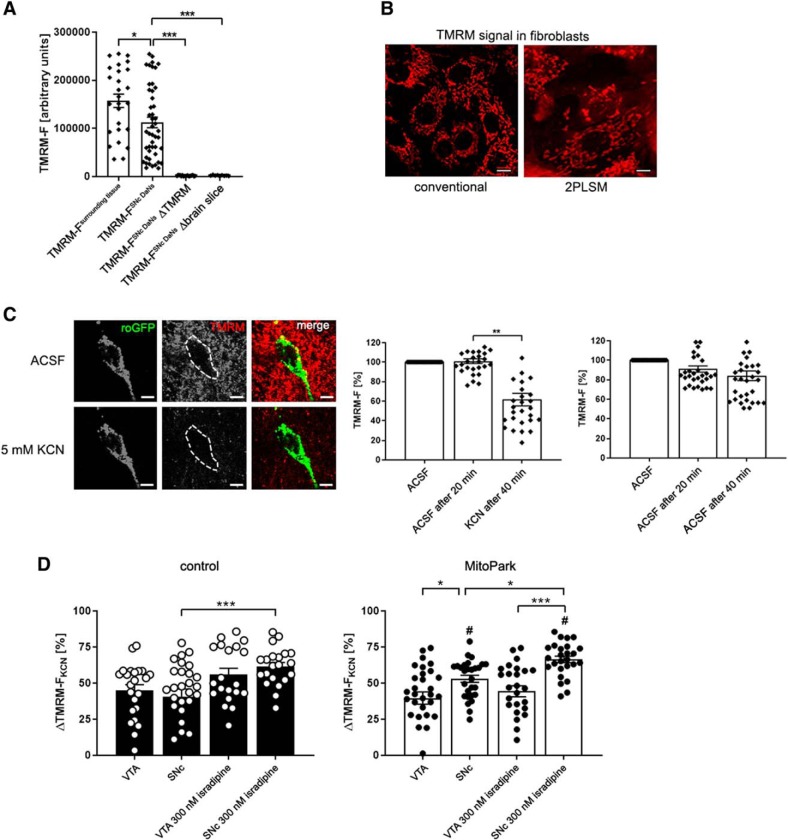
KCN induces an increase of ΔTMRM-FKCN in MitoPark SNc DaNs. A, Quantitative data presenting a high fluorescent TMRM signal in the surrounding of cell somata and midbrain DaNs compared with DaNs from sections that were not loaded with TMRM and ACSF containing TMRM without tissue, respectively. B, TMRM visualizes the mitochondrial network in mouse fibroblasts. Pictures were taken by using both conventional fluorescent microscope and 2PLSM. Scale bar, 10 μm. C, TMRM signal of a mito-roGFP expressing midbrain DaN before and after application of KCN. Scale bar, 10 μm. KCN (5 mm) induced a significant reduction of the TMRM signal in the soma of DaNs. D, Reduction of the TMRM signal after KCN application was used to calculate the difference between TMRM fluorescence before and after KCN (ΔTMRM-FKCN = TMRM-FACSF, 20 min − TMRM-FKCN, 40 min). Low TMRM signal intensities induced by KCN are reflected by high ΔTMRM-FKCN values. A high ΔTMRM-FKCN value, in turn, represents a high mitochondrial membrane potential. ΔTMRM-FKCN did not differ between VTA and SNc DaNs in control animals. However, in MitoPark mice, SNc DaNs showed a significantly higher ΔTMRM-FKCN deflection compared with MitoPark VTA and control SNc DaNs. Administration of KCN to midbrain sections pre-incubated with 300 nm isradipine led to a significant elevation of ΔTMRM-FKCN in control and MitoPark SNc DaNs. In contrast, the use of isradipine did not alter the TMRM signal in both control and MitoPark VTA DaNs. # indicates differences between control and MitoPark mice. Data are presented as mean ± SEM. (Control VTA: n = 23 neurons, MitoPark VTA: n = 31 neurons, control VTA + 300 nM isradipine: 20 neurons, MitoPark VTA + 300 nM isradipine: n = 26 neurons, control SNc: n = 28 neurons, MitoPark SNc: n = 28 neurons, control SNc + 300 nM isradipine: n = 21 neurons, MitoPark SNc + 300 nM isradipine: n = 26 neurons, 3–6 mice per group; *p < 0.05, **p < 0.01, ***p < 0.001, #p < 0.05).

