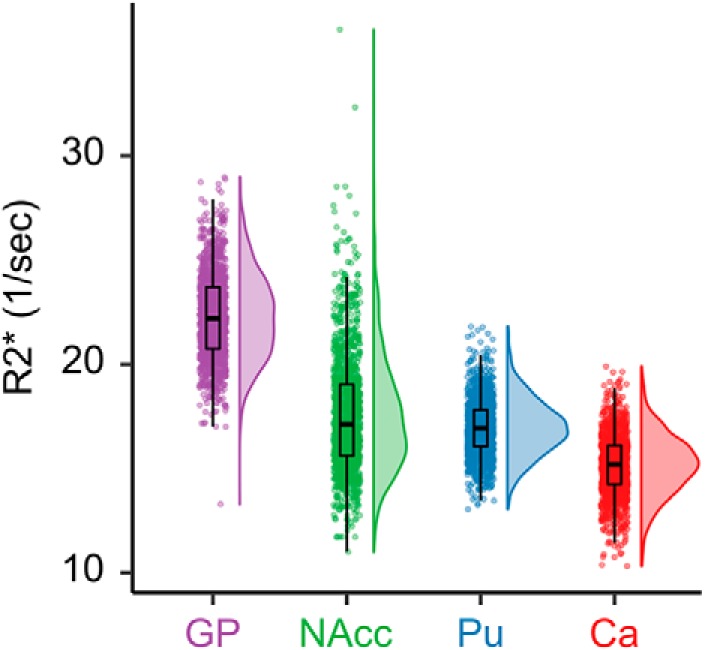
Figure 3.

Sample distribution of R2* across basal ganglia regions of interest. Individual points represent regional R2* values for individual scans. Boxplots indicate the median value, as well as the first and third quartiles of the sample distribution. GP, Globus pallidus; NAcc, nucleus accumbens; Pu, putamen; Ca, caudate.
