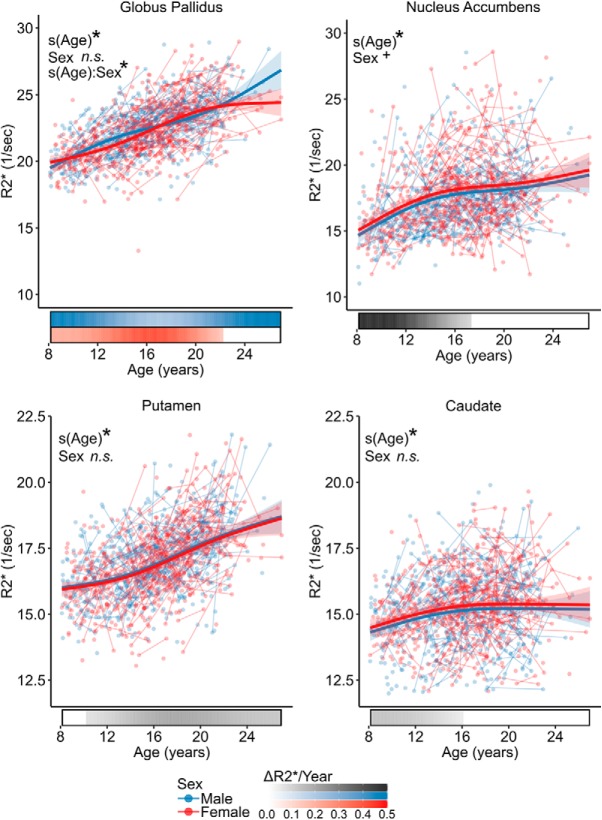
Figure 4.
Development of R2* in the basal ganglia. Plots display fitted R2* trajectories from GAMM models plotted by age for males (blue) and females (red). Individual points represent individual scans, with lines indicating scans from the same participant. Bars below the x-axis depict the derivative of the fitted smooth function. The filled portion of the bar indicates periods where the magnitude of derivative is significant, with the saturation of the fill representing the value of derivative in units of ΔR2*/year. *p < 0.05 after Bonferroni correction; +p < 0.1 after Bonferroni correction; n.s., not significant.

