
Figure 5.
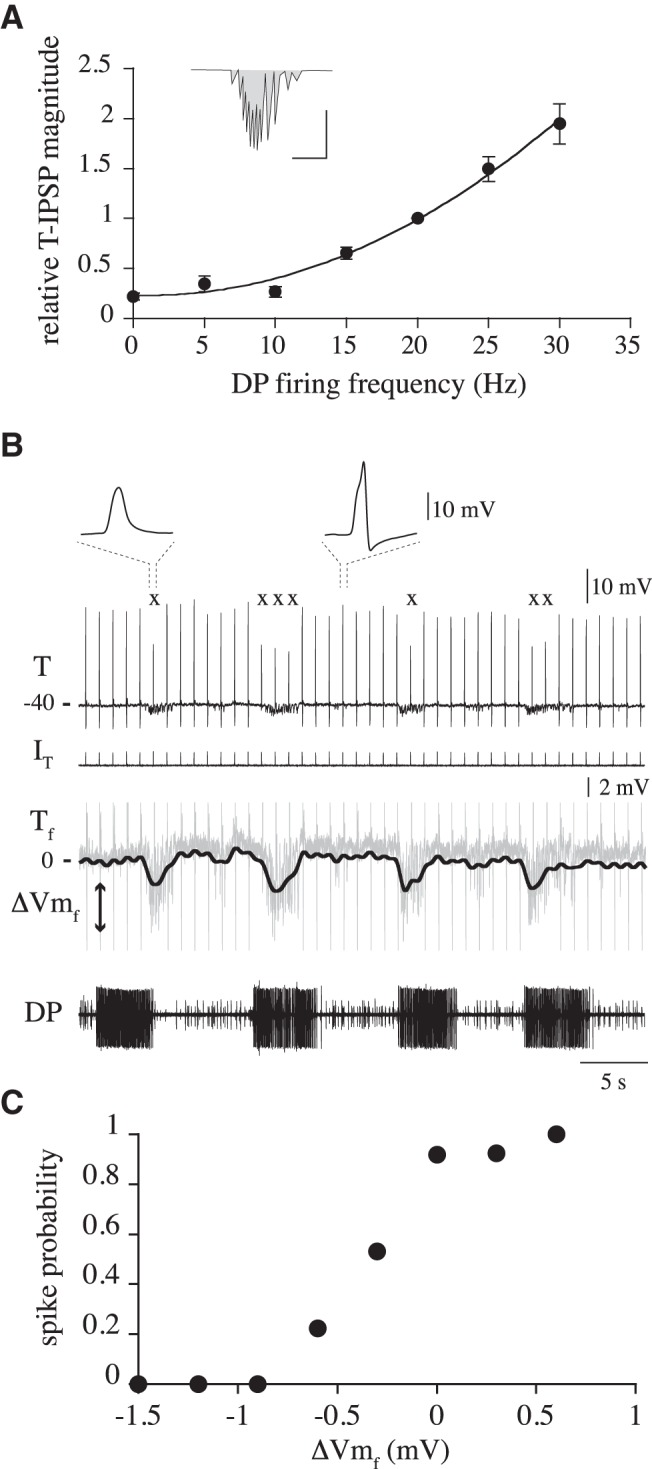
Magnitude and power of the T-IPSPs. A, Graph represents the magnitude of the IPSPs as a function of the firing frequency of the corresponding DP burst. The T-IPSPs (n = 243 cycles from 13 ganglia from 9 leeches) were measured as the area under the curve as shown in the inset (vertical and horizontal scales: 2 mV and 1 s, respectively); and are expressed relative to the mean IPSP magnitude correlated with a DE-3 firing frequency of 20 Hz in each crawling episode. 0 Hz corresponds to IPSPs generated in between DE-3 bursts. B, Top, Bottom, Simultaneous activity of a T cell and a DP nerve, respectively, in the course of a crawling episode, as 5 ms pulses (IT, 0.5 nA) were injected in the T cell at 1 Hz. The amplitude of the pulses was adjusted to generate a spike when T was at its baseline (in between IPSPs). The number on the left of the intracellular recordings indicates the membrane potential in mV; x indicates the pulses that did not result in a T spike. Inset above traces, Temporal expansion of the events enclosed in the dashed lines, showing a subthreshold depolarization (left) and a spike (right), clearly distinguishable by their respective amplitudes and the lack of the typical T afterhyperpolarization. Underneath the T-cell recording, we show, in gray, an amplitude amplification of this trace; and superimposed, the thick line indicates the low (0.5 Hz) pass filtered trace (Tf) of the recording. The average membrane potential of the trace was subtracted from it. C, Graph represents the probability that a T-pulse generated a spike as a function of the change in Tf (n = 264 pulses, in 4 ganglia from 3 leeches).