
Figure 1.
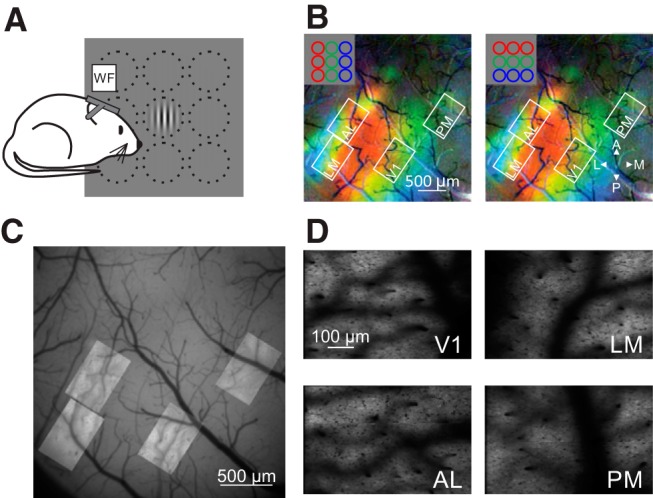
Targeting HVAs for 2P imaging. A, Schematic of rough retinotopic mapping experiments. Under wide-field fluorescence microscopy, mice were presented 30° diameter Gabor gratings at 1 of 9 positions in a 3 × 3 grid. B, Pseudocolored retinotopic maps showing changes in fluorescence (dF/F) in response to stimuli across three azimuths (left) or elevations (right) for an example mouse. White squares show FOVs acquired from V1, LM, AL, and PM during 2P imaging. Note that the FOVs target the green area that corresponds to a retinotopic location centered on the monitor. C, Alignment and overlay of average FOVs from 2P imaging sessions on vasculature map collected with single-photon fluorescence from the example mouse in B. D, Mean intensity images of FOVs from 2P imaging sessions.