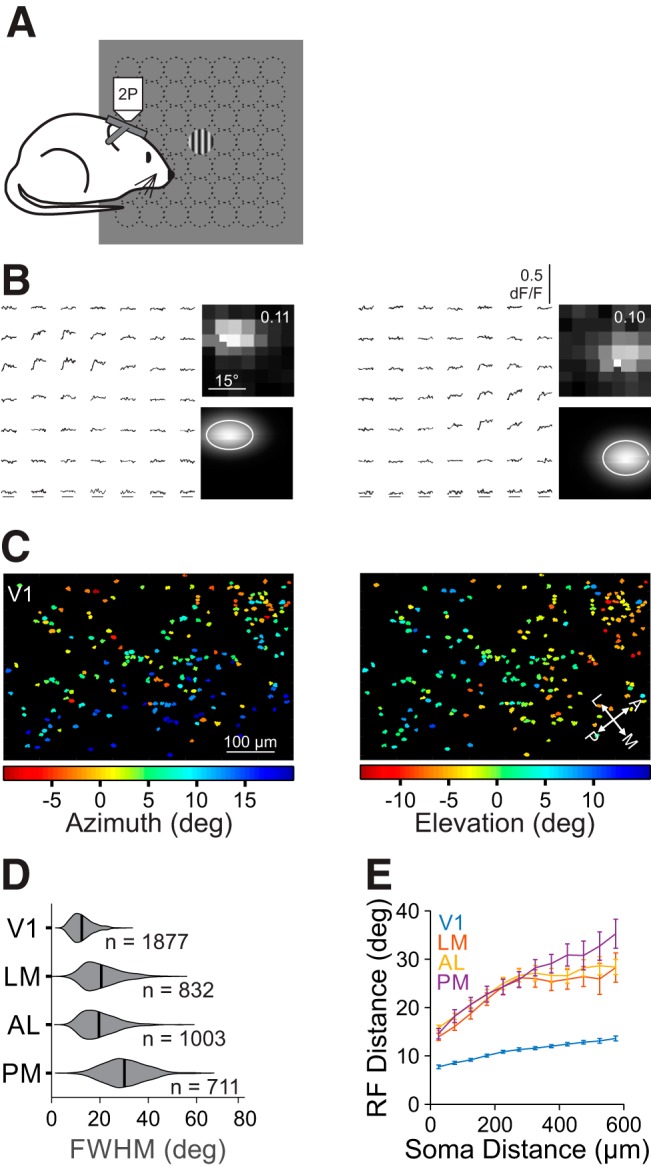
Figure 2.

Retinotopic mapping of V1 and HVAs reveals differences in RF size across areas. A, Schematic of fine RF mapping experiments. Under 2P fluorescent microscopy, mice were presented circularly-apertured gratings at one of 49 positions in a 7 × 7 grid. B, Left, Average dF/F time courses for two example cells in response to stimuli in each of the 49 positions. Right Average responses (top; value is the maximum dF/F) and 2D Gaussian fits (bottom contour is 1 σ) for the cells above. C, RF center azimuth (left) and elevation (right) for all cells in an example V1 FOV. D, Summary of RF size (FWHM) for all neurons in each area. Violins are kernel density estimators; thick bars are mean. E, Summary of the average inter-RF distance for all pairs of well fit cells within each FOV as a function of distance in cortical space. Error bars indicate SEM across FOVs within each area.
