Figure 3.

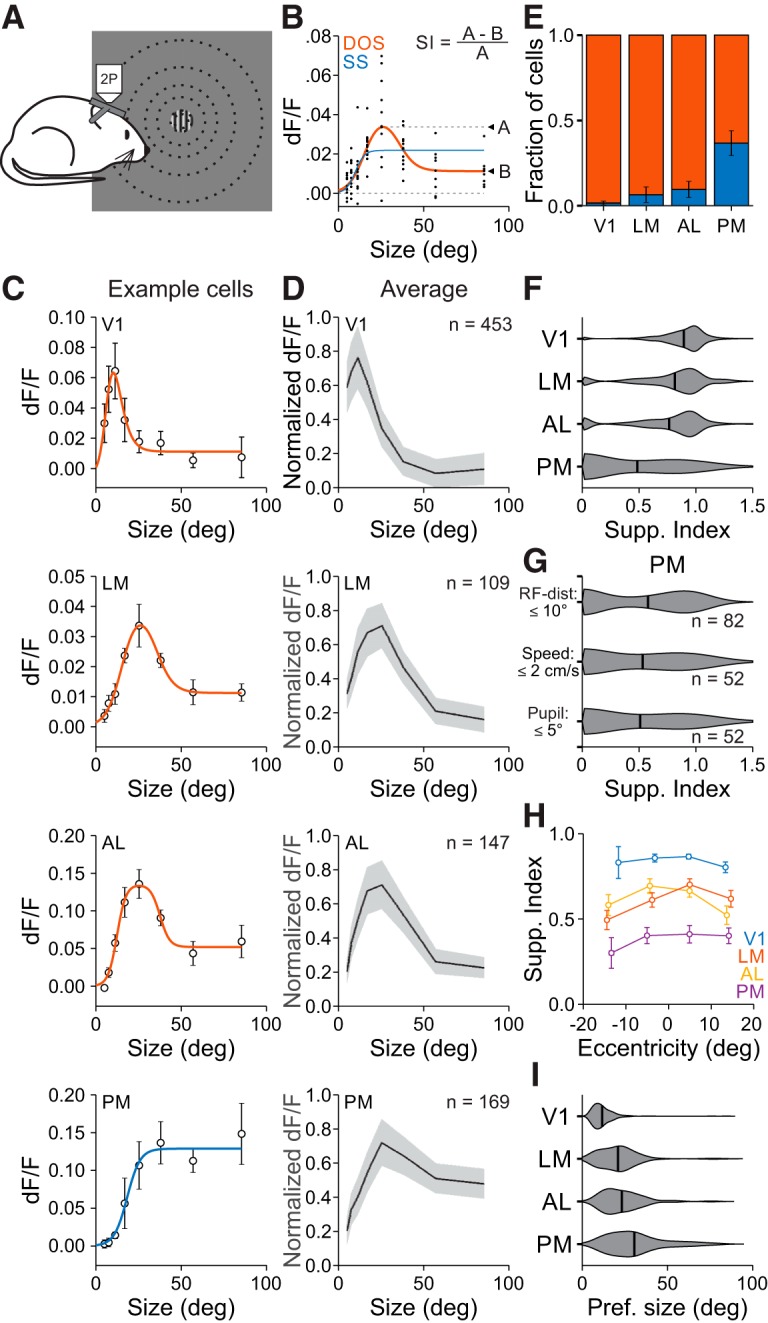
Size is encoded differently across visual cortical areas. A, Schematic of size-tuning experiments. During 2P imaging, gratings of varying size are presented at a fixed position. B, Single-trial responses (black dots) to stimuli of varying size fit with a SS (blue) and a DOS (red) for an example cell. If the SS is the better fit, then the SI is zero; if the DOS is the better fit, then the SI is equal to the ratio of the difference between the dF/F at the preferred size and the largest size to the dF/F at the preferred size. C, Average dF/F responses and best fit for an example cell in each area. Cell in LM is the cell in B. Error bars indicate ±SEM across trials. D, Average responses to each size stimulus across all well fit cells in each area within 50% of the FWHM for that area. Error bars indicate ±SD across cells. E, Proportion of cells best fit by an SS (blue) or DOS (red). Error is ±SEP across cells. F, Summary of SI by area. G, Summary of suppression index in PM when using the same criteria as in LM/AL for RF distance from the stimulus (top), trials in which the mouse was stationary (middle), and trials in which the pupil position was consistent (bottom). H, SI as a function of RF eccentricity for all areas. Error bars indicate ±SEM across cells. I, Summary of preferred size by area.
