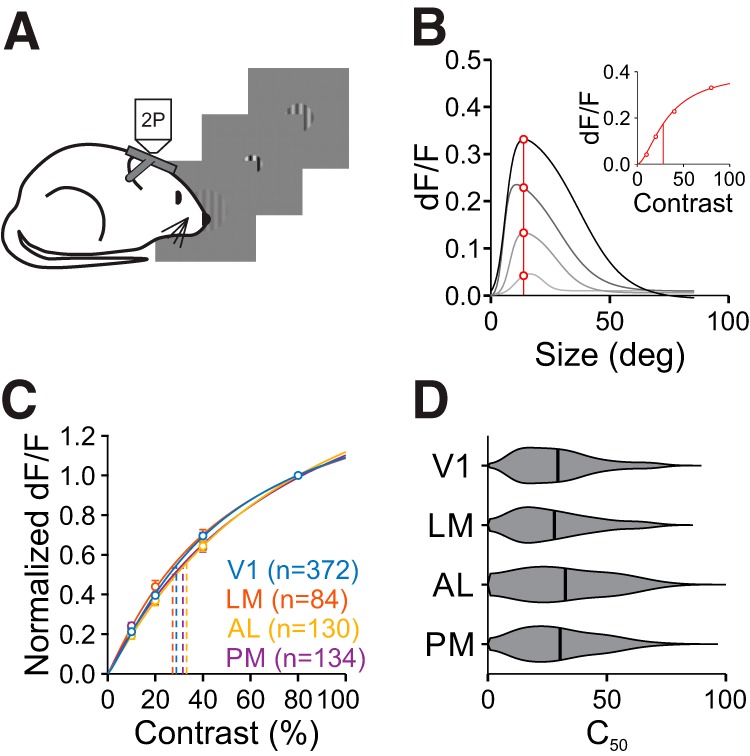
Figure 4.

Contrast sensitivity is similar across areas. A, Schematic of size-by-contrast-tuning experiments. During 2P imaging, mice are presented circularly-apertured gratings of variable size and contrast at a fixed position. B, Contrast-response extraction in an example cell. Response values at the cell's preferred size (red line and circles, found at the highest contrast) were extracted from size-tuning curves across four contrasts (gray curves). Inset, Contrast response function for this cell fit with the Naka–Rushton equation. Vertical line is C50. C, Summary of averaged normalized contrast response functions at the preferred size across areas. Error bars indicate ±SEM across cells. Fits are of average contrast response measures. D, Summary of C50 for all cells in each area.
