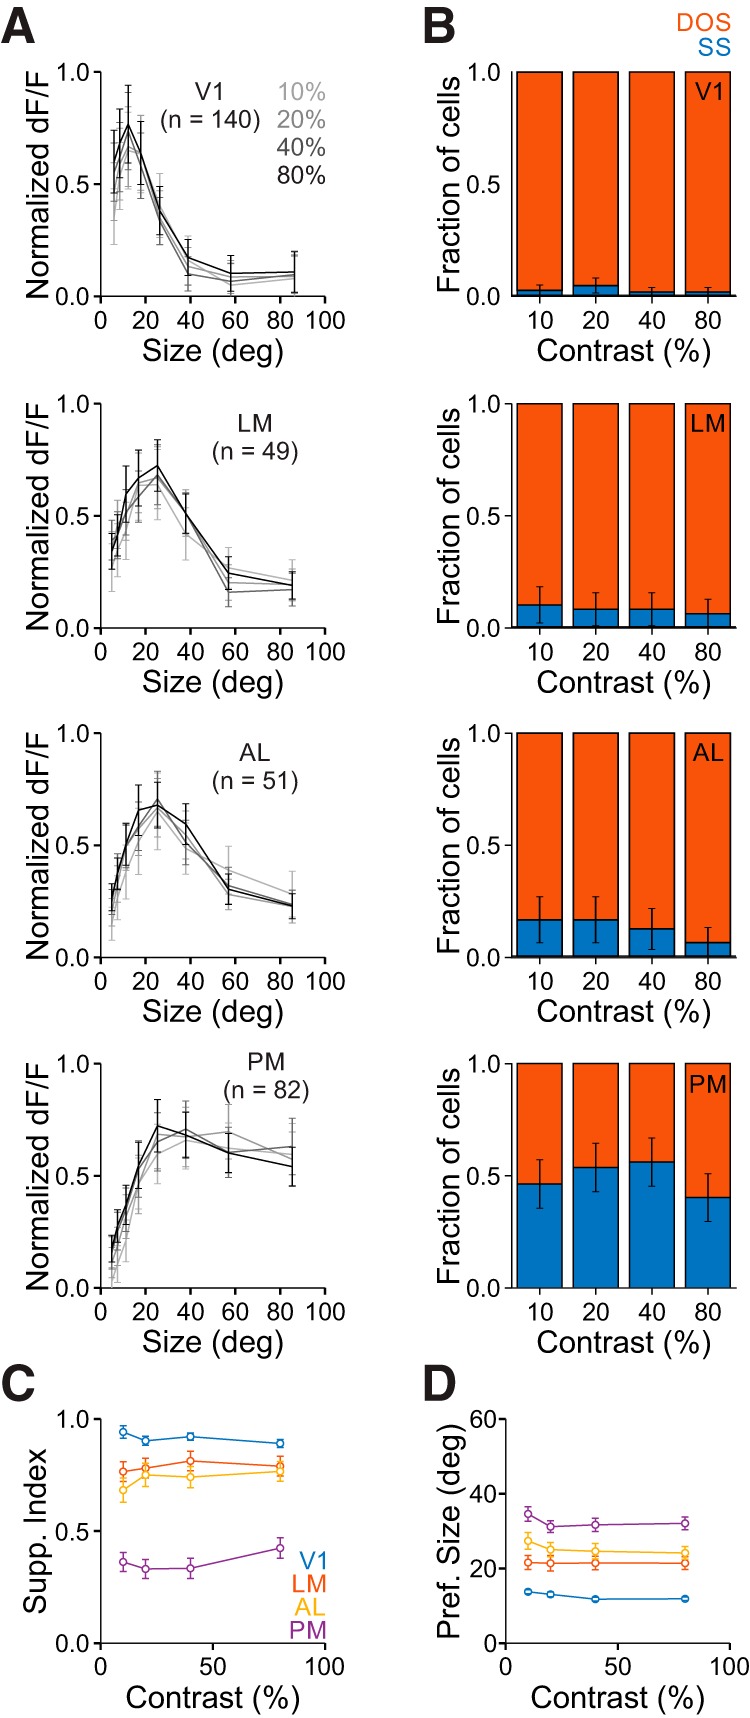
Figure 5.

Differences in size tuning in V1 and the HVAs is conserved across contrasts. A, Average responses of all cells in each area to each size for all contrasts. Data are normalized to the maximum response for each cell at each contrast. Error bars indicate ±SEM across cells. B, Proportion of cells best fit by an SS (blue) or DOS (red) for each contrast in each area. Error bars indicate ±SEP across cells. Ten percent versus eighty percent contrast p > 0.05 for all areas. C, Summary of suppression index as a function of contrast in each area. Error bars indicate ±SEM across cells. D, Same as C, for preferred size.
