Figure 6.

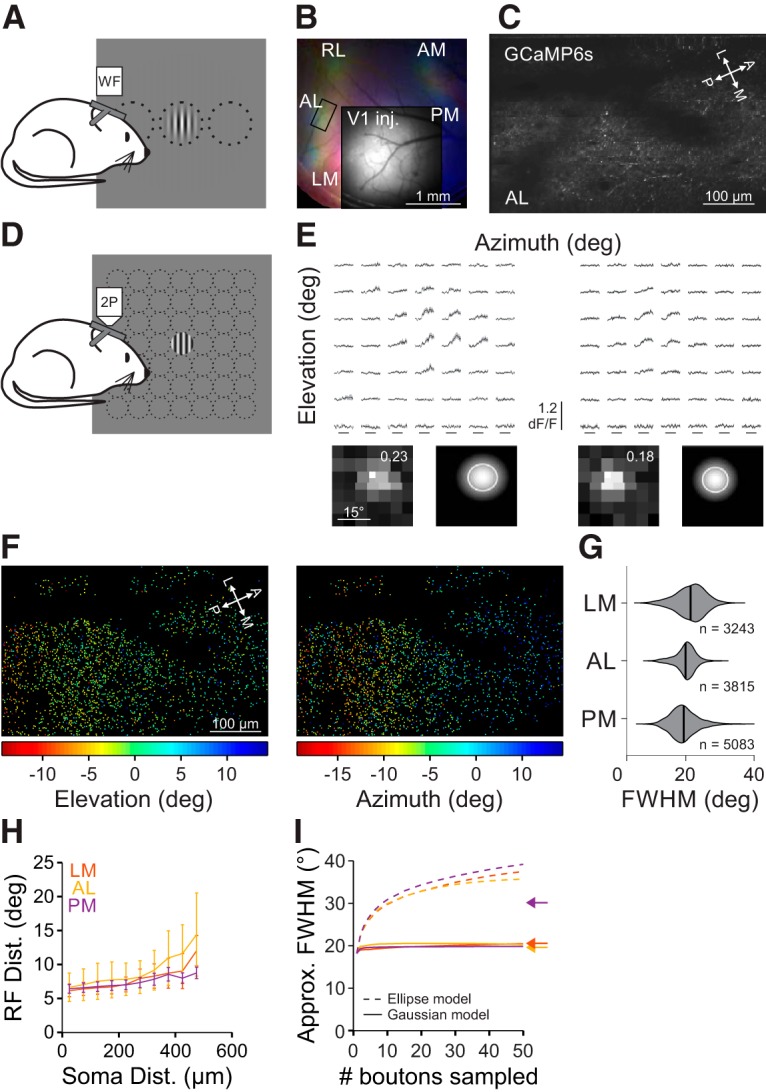
RF size of V1 inputs to the HVAs is similar across areas. A, Schematic of wide-field (WF) imaging stimulus and setup. B, Pseudo-color image of changes in fluorescence (dF/F) in axonal projections from V1 to the HVAs in response to stimuli of different azimuth (same conventions as Fig. 1B) for an example mouse. Inset, Raw fluorescence (F) image of the injection site in V1. C, Average fluorescence image of an example FOV from the region of interest in B (rectangle in AL). D, Schematic of fine RF mapping stimulus for 2P imaging. E, Average fluorescence (dF/F) traces (top) and RF with fit (bottom; same conventions as Fig. 2B) for two example cells from the FOV in C. F, RF center azimuth (left) and elevation (right) for all V1 boutons in the FOV in C. G, Summary of RF size for V1 boutons in each HVA. H, Summary of the average inter-RF distance for all pairs of well fit boutons within each FOV as a function of distance in cortical space. Error bars indicate SEM across FOVs within each area. I, Summary of the approximate FWHM of modeled aggregate RFs as a function of the number of boutons sampled, when summing either ellipses (dashed) or 2D Gaussians (solid) as a template for RF size. Arrows indicate the average FWHM of RFs within each HVA.
