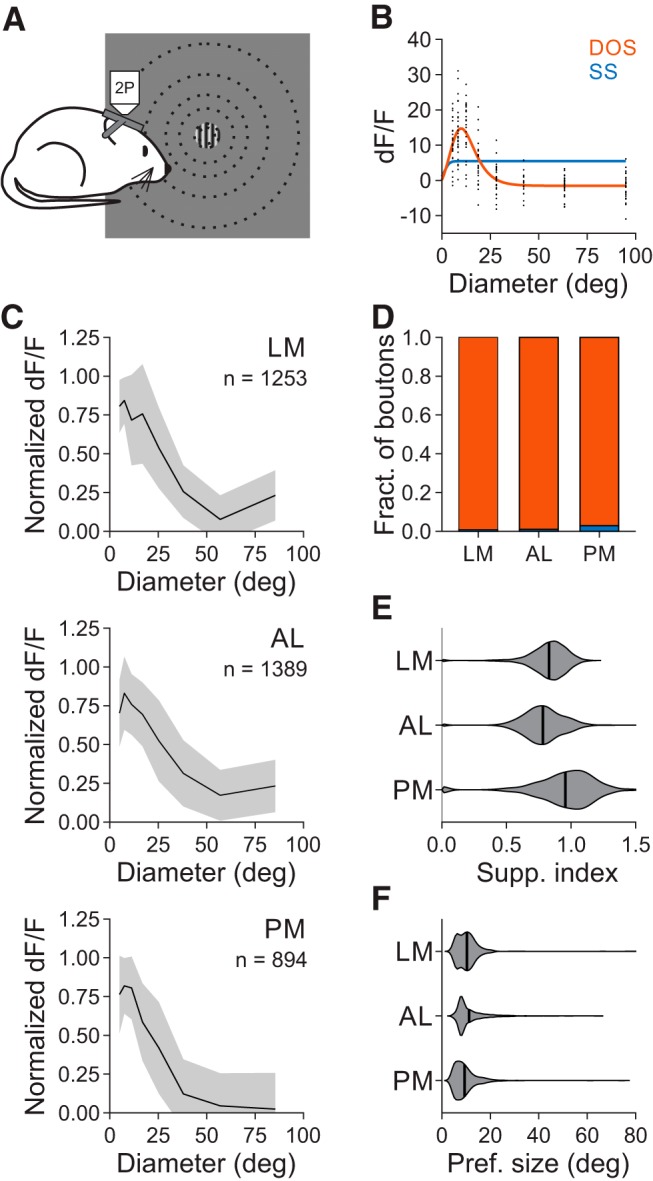
Figure 7.

Size tuning of V1 inputs to the HVAs is similar across areas. A, Schematic of stimulus protocol for size tuning experiments. B, Example single trial (black) responses to stimuli of varying size for a single cell (same conventions as in Fig. 3B). C, Average normalized dF/F for all well fit boutons in each area. Error bars indicate ±SD across cells. D, Proportion of boutons best fit by an SS (blue) or DOS (red) in each area. Error bars indicate ±SEP across cells. E, Summary of suppression index for all well fit boutons in each area. F, Same as E, for preferred size.
