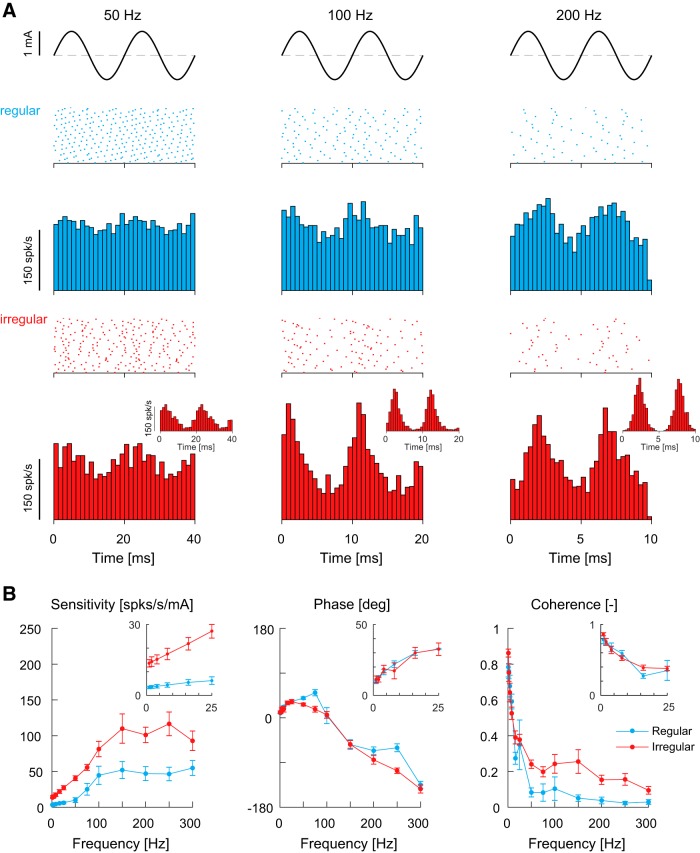
Figure 4.
Firing behavior and response dynamics of monkey vestibular afferents to high-frequency (0–300 Hz) sinusoidal electrical vestibular stimulation. A, Raster plots from 50 cycles of stimulus oscillation and mean firing rate histograms of example regular (blue) and irregular (red) afferents at 50, 100, and 200 Hz stimuli. The majority of afferents responded to the electrical stimulus by modulating their firing rate, however, some irregular vestibular afferents tended to lock their firing to specific phases of the input stimulus (insets), particularly when the stimulus frequency exceeded ∼100 Hz. B, Population average sensitivity, phase and coherence plotted as a function of frequency for regular (blue, n = 10–15) and irregular (red, n = 8–12) afferents. Responses at low frequencies are included as insets for comparison. Error bars indicate 1 SEM.

